Research
(Advertisement)


ICP Price Analysis: Internet Computer Tests All-Time Lows as Bitcoin Recovery Offers Slim Hope

ICP trades near all-time lows around $2.43 as Bitcoin's tentative recovery offers limited relief. Key levels, moving averages, and catalysts to watch.
Miracle Nwokwu
February 14, 2026

(Advertisement)
Table of Contents
After weeks of relentless selling pressure across the crypto market, Internet Computer (ICP) is showing faint signs of life. The token, currently trading around $2.43, ticked up roughly 1.5% in the past 24 hours — a small but notable move that mirrors Bitcoin's own tentative bounce from its early February lows near $60,000 back toward the $66,000–$70,000 range. The parallels aren't perfect, but the pattern is familiar: when Bitcoin stabilizes, altcoins tend to follow, even if their recoveries are far more fragile.
For ICP holders, though, the last 30 days have been painful. The token entered mid-January trading near $3.40 after a brief rally that had sparked cautious optimism. That momentum didn't last. As Bitcoin began its steep descent from above $80,000 — eventually crashing to $60,000 on February 5 in one of the steepest single-day drops since the FTX collapse — ICP got dragged down with it, sliding from the $3.40 zone all the way to fresh lows near $2.00.
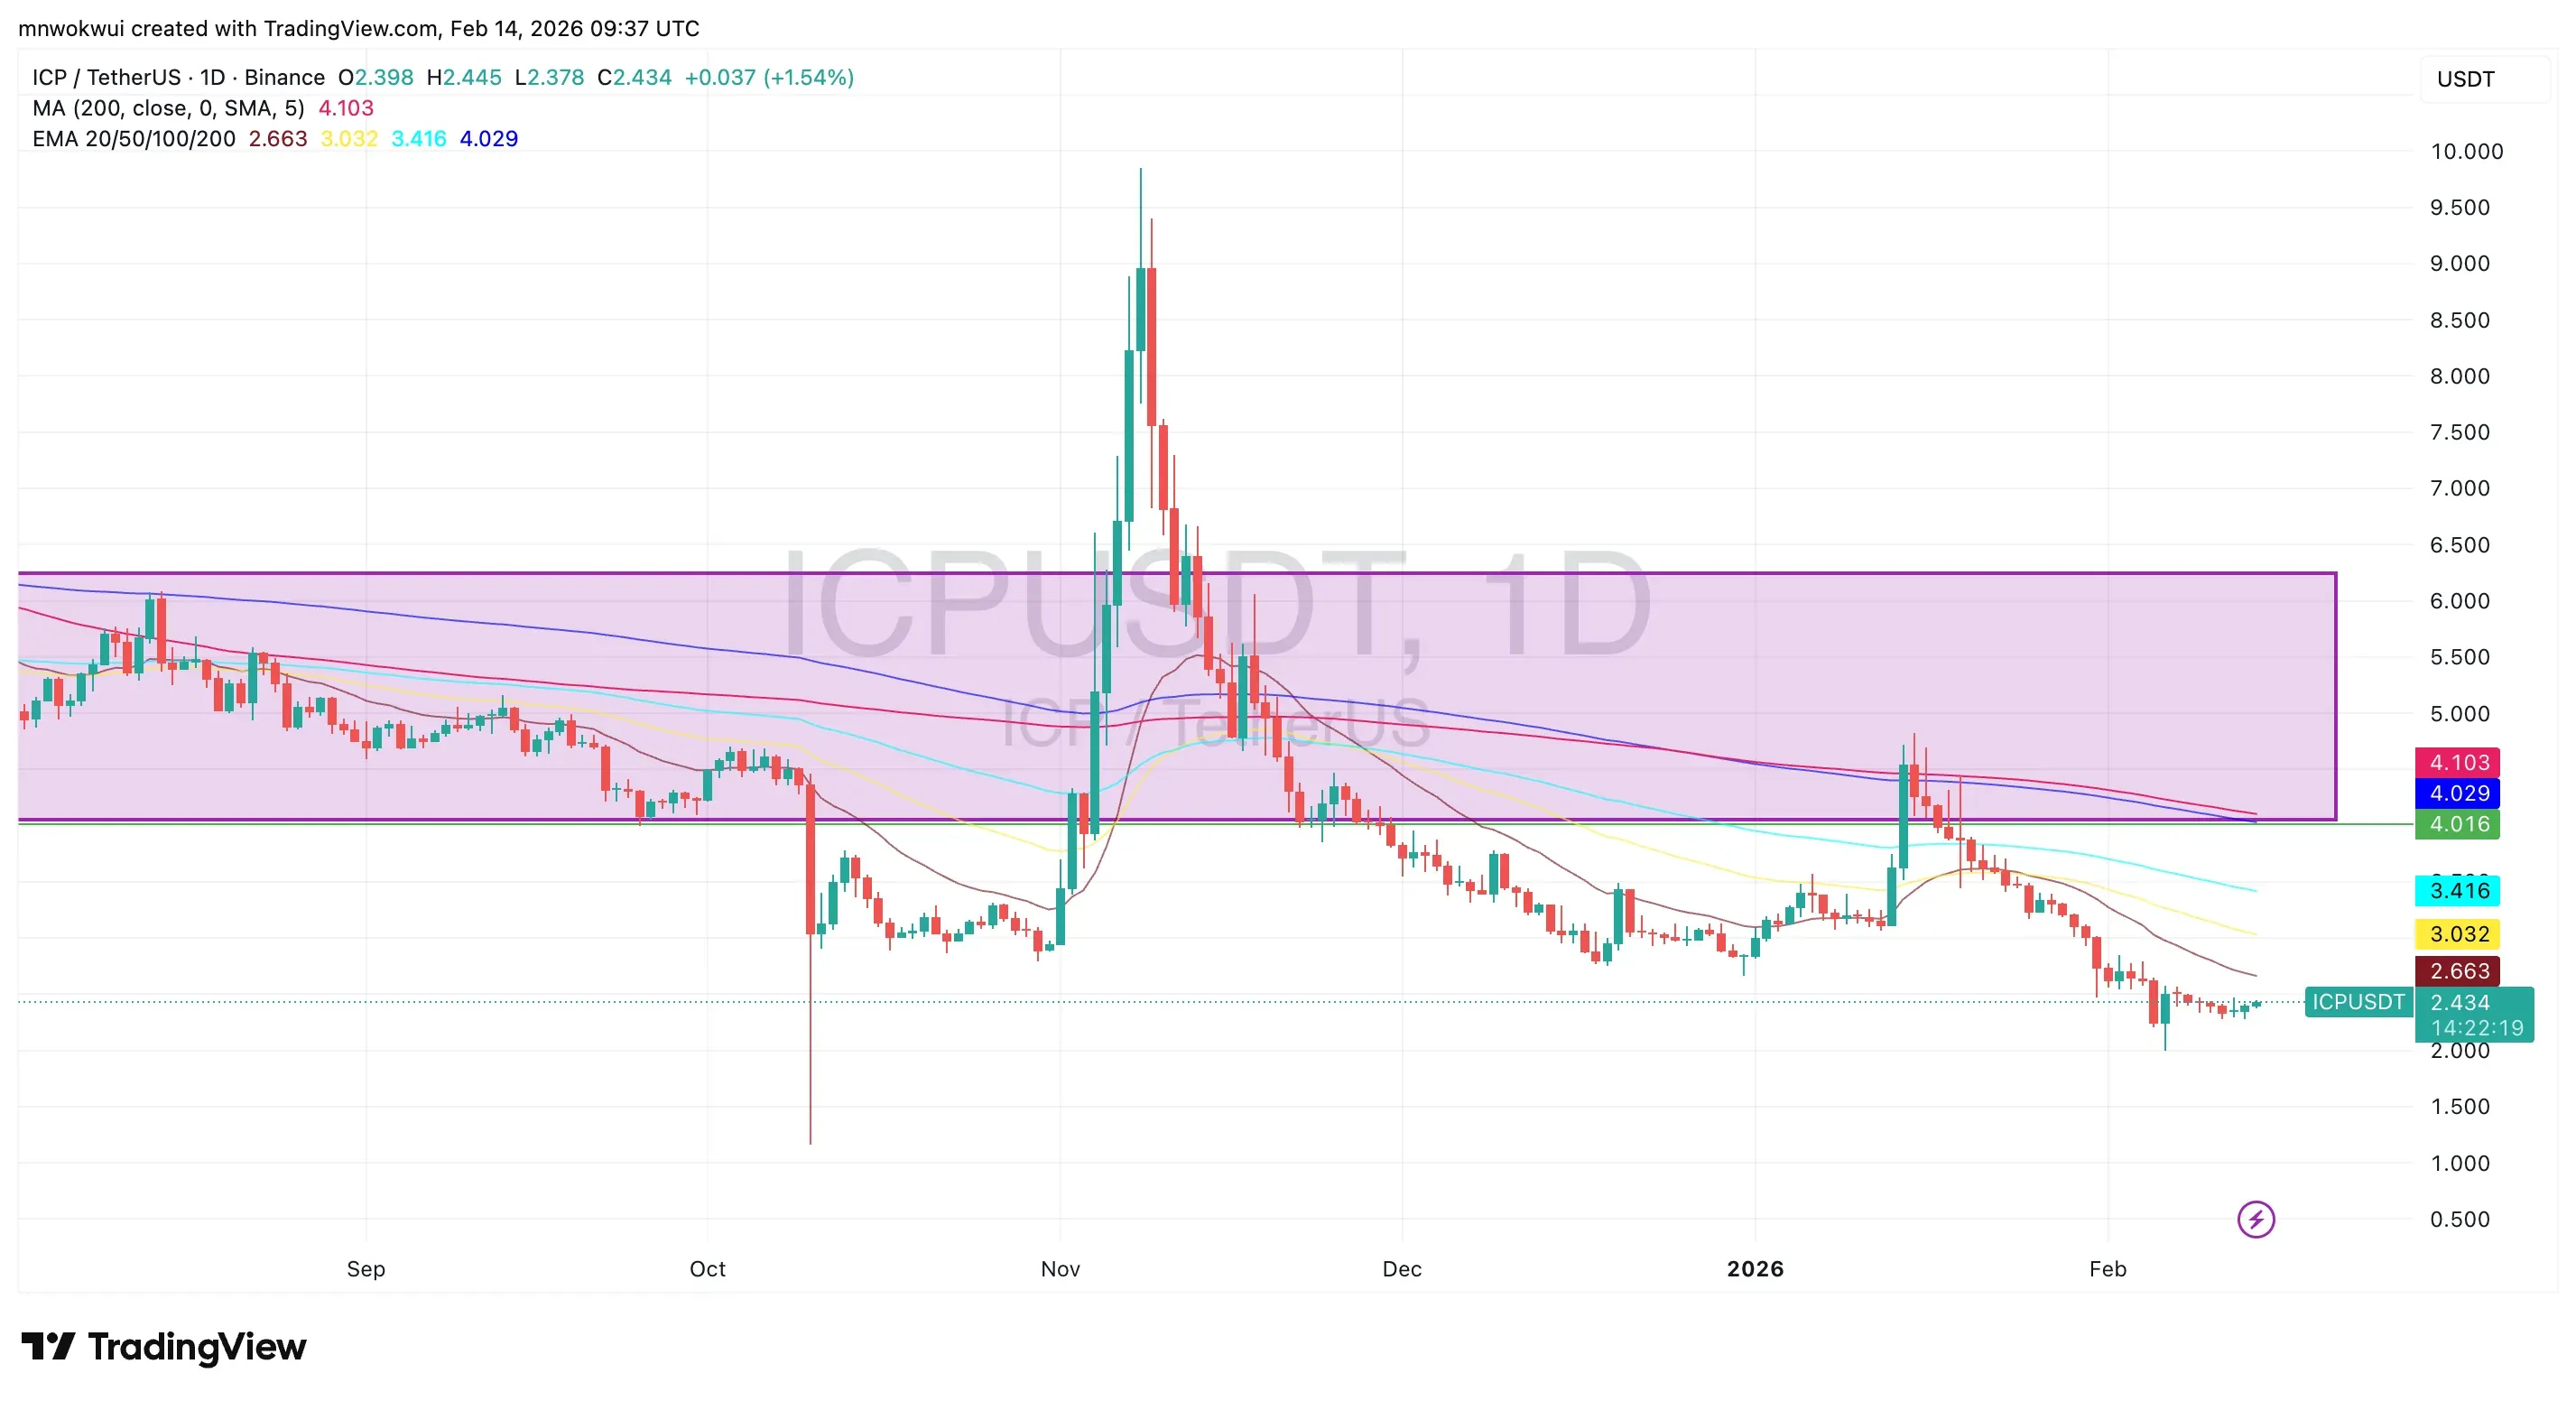
The damage is clearly visible on the daily chart. ICP is now trading well below every major moving average. The 200-day SMA sits at $4.10, the 200-day EMA at $4.03, and even the faster 20-day EMA hovers around $2.66 — all overhead. That kind of separation between price and its moving averages tells a straightforward story: this is a token in a deeply bearish trend, and any recovery is fighting against serious structural headwinds.
What the Bulls Need to See
The bullish case here is admittedly thin, but it exists. ICP has bounced off the $2.00 area twice in recent sessions, which is creating what looks like a short-term floor — notably close to its all-time low of $2.08. If that level holds, it could serve as a base for a relief rally toward the $2.66 zone, which aligns with the 20-day EMA and would represent the first meaningful resistance test.
Beyond that, a push back above $3.00 — a level ICP lost in late January — would be the first signal that sellers are losing control. The broader macro backdrop offers some help, too. JPMorgan recently came out with a bullish stance on crypto for 2026, arguing that institutional flows are likely to pick up as regulatory clarity improves. If Bitcoin can reclaim $75,000 or higher, the resulting risk-on sentiment could give altcoins like ICP a meaningful lift.
There's also DFINITY's proposed Mission70 initiative — aimed at reducing ICP inflation by 70% during 2026. If implemented through an NNS governance vote, it would introduce a deflationary dynamic that could shift the token's long-term supply narrative. That's a fundamental catalyst worth watching, even if it hasn't been priced in yet.
The Bearish Reality
On the other side of the ledger, the technical picture is stark. Every major moving average — the 20, 50, 100, and 200-day — is sloping downward and sitting above the current price. That's textbook bearish alignment. The Fear & Greed Index for ICP sits at 9, deep in "extreme fear" territory, and only 23% of the last 30 trading days have been green.
If the $2.00 support fails, there's not a lot of historical structure below it before things get truly uncomfortable. ICP's all-time low of $2.08 was set during the depths of the 2022 bear market, and a decisive break below that level would effectively put the token in uncharted bearish territory — a scenario that could trigger further capitulation.
The macro picture doesn't offer much comfort either. Bitcoin's own recovery remains fragile. Prediction markets give BTC just a 54% chance of reclaiming $75,000 by month's end and only 10% odds of returning to $100,000 anytime soon. If Bitcoin rolls over again, altcoins like ICP — which already sit near historic lows — would likely bear the brunt of renewed selling.
For ICP price recovery to mean anything, bulls need to reclaim $2.66 as a first step and $3.00 as confirmation that the worst is behind them. Until then, ICP remains a token fighting for survival at the bottom of its range — and every rally is a sell until the moving averages say otherwise.
Read Next...


Disclaimer
Disclaimer: The views expressed in this article do not necessarily represent the views of BSCN. The information provided in this article is for educational and entertainment purposes only and should not be construed as investment advice, or advice of any kind. BSCN assumes no responsibility for any investment decisions made based on the information provided in this article. If you believe that the article should be amended, please reach out to the BSCN team by emailing [email protected].
Author
 Miracle Nwokwu
Miracle holds undergraduate degrees in French and Marketing Analytics and has been researching cryptocurrency and blockchain technology since 2016. He specializes in technical analysis and on-chain analytics, and has taught formal technical analysis courses. His written work has been featured across multiple crypto publications including The Capital, CryptoTVPlus, and Bitville, in addition to BSCN.
(Advertisement)
Latest News
8h : 14m ago
XRP Ledger's v3.2.0 Upgrade Explained
9h : 37m ago

Big News for Morpho and Ethena: What is Robinhood Earn?
11h : 59m ago

What Does XRP's Relationship With Banks Actually Look Like?
17h : 29m ago

How Does InterLink Solve the Bot Problem in Web3?
July 7, 2026
The 90% Myth
July 7, 2026

License Secured: Ripple's Biggest European Win Ever
July 7, 2026

How Much Bitcoin Has Saylor's Strategy Sold?
July 7, 2026

What Does It Mean to Rent Blockspace on Polkadot, and Who's Doing It?
(Advertisement)

Crypto Project & Token Reviews
Project & Token Reviews
Comprehensive reviews of crypto's most interesting projects and assets
Learn about the hottest projects & tokens
Latest Crypto Articles
Get up to date with the latest crypto news stories and events