Research
(Advertisement)


Pi Network (PI) Price Lags Market Rebound as Technical Weakness Persists Into 2026

Pi Network (PI) underperforms during the market’s modest recovery, as charts point to ongoing selling pressure and weak volume support.
Miracle Nwokwu
January 24, 2026

(Advertisement)
Pi Network’s PI token has started the year on a subdued note, lagging behind the modest recovery seen across parts of the broader crypto market. While several large-cap assets have attempted relief rallies in early January, PI has remained largely range-bound near its recent lows, reflecting persistent selling pressure and cautious sentiment among holders.
For many Pioneers who anticipated stronger post-new-year momentum, the slow price response is becoming a point of visible frustration.
On the daily chart, PI/USDT continues to trade within a well-defined broader downtrend that has been in place for months. Since the year began, price action has hovered around the $0.18–$0.20 zone, with repeated failures to establish a sustained move above short-term resistance.
A recent sharp downside wick toward the mid-$0.15 area was quickly bought, but the rebound lacked follow-through — a sign that dip demand exists, yet conviction remains limited.
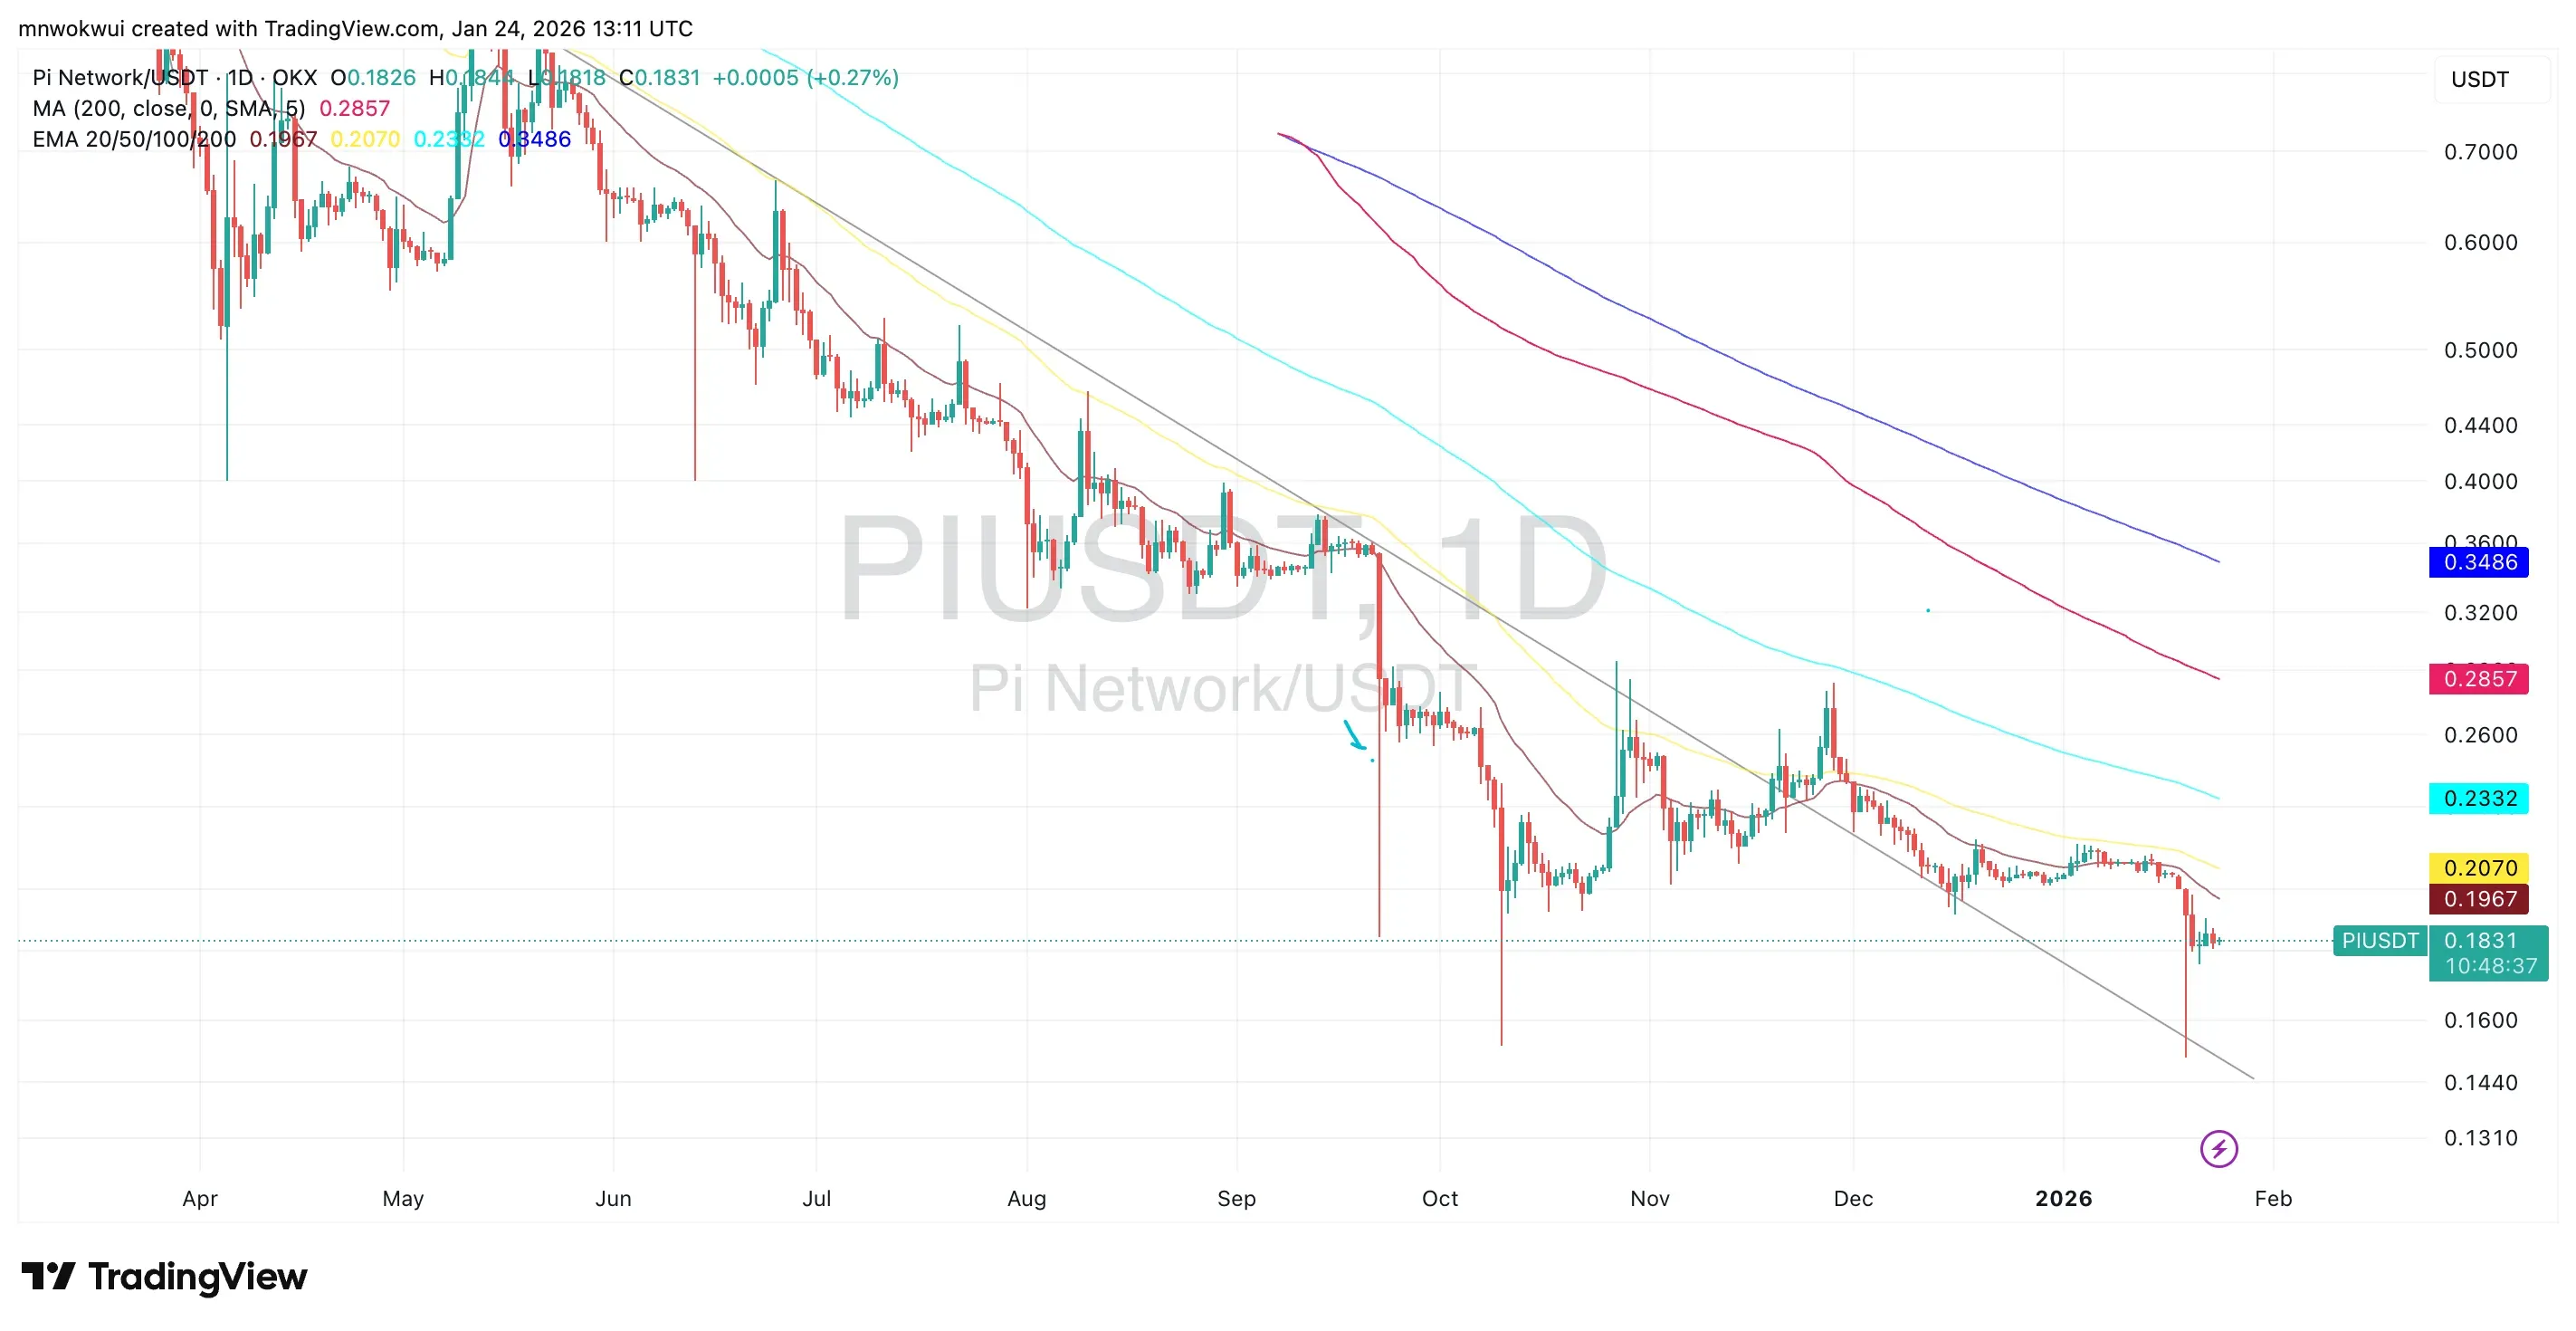
Technically, the structure still favors bears. Price is trading below all major moving averages, including the 20-day, 50-day, 100-day, and 200-day lines, which are stacked in bearish alignment and sloping downward. This configuration typically reflects a market where rallies are viewed as selling opportunities rather than trend reversals. Each attempt to push higher since early January has been capped near the declining short-term averages, reinforcing the idea of dynamic resistance overhead.
Volume behavior also suggests a lack of aggressive accumulation. While there have been occasional spikes on volatile sessions, sustained expansion in bullish volume — usually needed to signal a durable bottom — has yet to appear.
Bearish Scenario
If PI fails to reclaim the $0.20–$0.21 region convincingly, the risk of further downside remains elevated. That area now acts as immediate resistance, aligning closely with short-term moving averages and prior consolidation breakdown levels. Continued rejection there could open the door for another test of recent lows around $0.16, with a deeper slide toward the $0.14–$0.15 zone possible if broader market sentiment weakens.
A daily close below the recent wick lows would be technically significant, as it would confirm that buyers are no longer defending that area effectively. In such a case, the longer-term downtrend structure would remain intact, and sentiment among retail holders could deteriorate further.
Bullish Scenario
For bulls, the first step is stability — holding above the mid-$0.16 to $0.17 support area and gradually building higher lows. A decisive break and daily close above $0.21 would be the first meaningful sign that short-term momentum is shifting. That could trigger a move toward the $0.23–$0.25 range, where stronger resistance from previous consolidation and the declining 100-day average comes into play.
A broader trend reversal, however, would require PI to reclaim levels above the $0.28–$0.30 zone and flatten the longer-term moving averages — something that currently appears distant but not impossible if market-wide risk appetite improves.
Until buyers demonstrate stronger commitment, the token’s early-year performance suggests consolidation at best and continued downside risk at worst, leaving Pioneers watching closely for a clearer shift in momentum.
Read Next...


Disclaimer
Disclaimer: The views expressed in this article do not necessarily represent the views of BSCN. The information provided in this article is for educational and entertainment purposes only and should not be construed as investment advice, or advice of any kind. BSCN assumes no responsibility for any investment decisions made based on the information provided in this article. If you believe that the article should be amended, please reach out to the BSCN team by emailing [email protected].
Author
 Miracle Nwokwu
Miracle holds undergraduate degrees in French and Marketing Analytics and has been researching cryptocurrency and blockchain technology since 2016. He specializes in technical analysis and on-chain analytics, and has taught formal technical analysis courses. His written work has been featured across multiple crypto publications including The Capital, CryptoTVPlus, and Bitville, in addition to BSCN.
(Advertisement)
Latest News
8h : 14m ago
XRP Ledger's v3.2.0 Upgrade Explained
9h : 37m ago

Big News for Morpho and Ethena: What is Robinhood Earn?
11h : 59m ago

What Does XRP's Relationship With Banks Actually Look Like?
17h : 29m ago

How Does InterLink Solve the Bot Problem in Web3?
July 7, 2026

The 90% Myth
July 7, 2026

License Secured: Ripple's Biggest European Win Ever
July 7, 2026

How Much Bitcoin Has Saylor's Strategy Sold?
July 7, 2026

What Does It Mean to Rent Blockspace on Polkadot, and Who's Doing It?
(Advertisement)

Crypto Project & Token Reviews
Project & Token Reviews
Comprehensive reviews of crypto's most interesting projects and assets
Learn about the hottest projects & tokens
Latest Crypto Articles
Get up to date with the latest crypto news stories and events