Research
(Advertisement)


Insights from CoinGecko's Q2 Crypto Report


CoinGecko's Q2 2026 report shows crypto market cap down 12.6% to $2.1T, while prediction market notional volume hit a record $113.8B.

Crypto Rich
July 17, 2026

(Advertisement)
Table of Contents
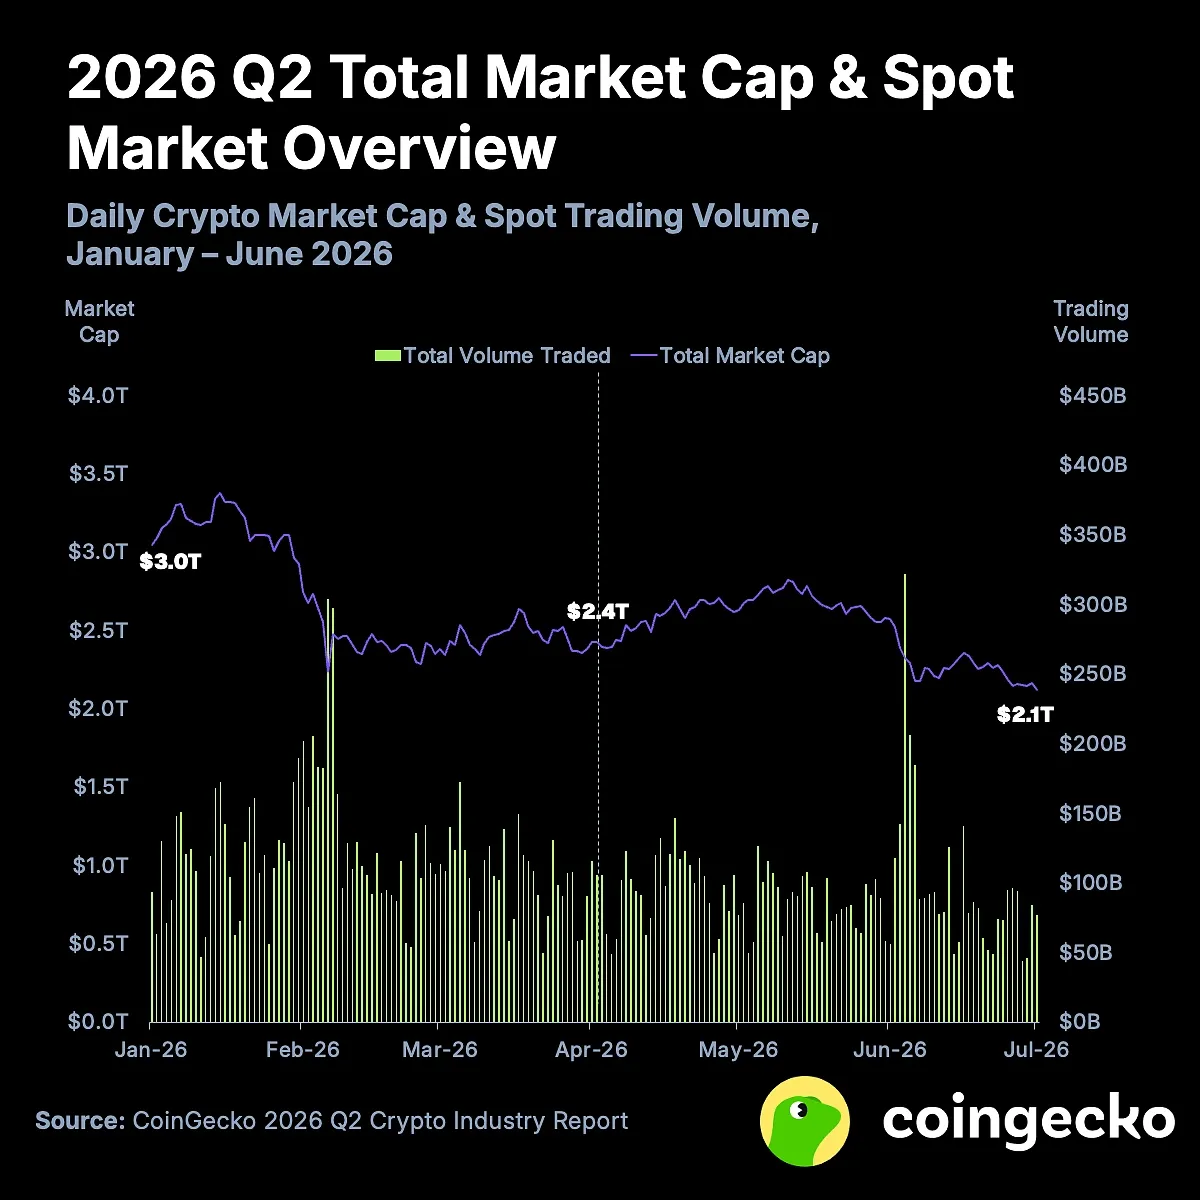
CoinGecko's (@coingecko) 2026 Q2 Crypto Industry Report, published July 16, shows a market that shrank for a third straight quarter while a small number of niches grew fast enough to stand out. Total crypto market cap fell 12.6% to $2.1 trillion, spot volume on centralized exchanges dropped 27.9%, and stablecoins posted their first quarterly decline since Q3 2023. Prediction markets went the other way, clearing $113.8 billion in notional volume, up 48.7% quarter on quarter.
That split is the story of the quarter. Money left the majors, but activity did not disappear. It moved somewhere with a clearer reason to trade.
How bad was the drawdown?
The market lost $304.8 billion in three months, closing June at $2.1 trillion. That is the lowest level since September 2024 and roughly 52% below the October 2025 peak.
Unlike Q1, which front-loaded its selling, Q2 started well. April was one of the strongest months of the year before momentum turned. The damage was concentrated in June, when a hawkish Fed stance, US-Iran tensions, rising ETF outflows, and a symbolic Bitcoin sale by Strategy coincided.
$BTC fell 14.2% and $ETH fell 25.4% over the quarter, both underperforming US equities, which staged a strong recovery over the same period. Crypto did not trade like a risk asset in Q2; it traded on its own problems. Average daily trading volume across the market fell 20.9% to $93.1 billion, a second consecutive quarter of cooling.
The weakness was not uniform. @HyperliquidX's $HYPE broke into the top 10 on the back of new ETFs, exposure to prediction markets, and a Coinbase deal, while the established large caps bled. That gap between struggling majors and pockets of specific speculative demand is the bifurcation the report keeps returning to.
Why the stablecoin dip matters more than the price drop
Stablecoin market cap slipped 1.6%, or $4.8 billion, to $305.1 billion. In percentage terms, that is small next to a 12.6% market decline. In signal terms, it is the more interesting number because it marks the first quarterly contraction since Q3 2023 and suggests capital is leaving the industry rather than rotating within it.
The breakdown was uneven:
- $USDC posted the largest outflow in dollar terms, down 4.8% or $3.7 billion, to $73.5 billion
- $USDT held roughly flat at $184.4 billion, up 0.2%, and lifted its share of the sector to 60%
- $USDS fell 16.4% to $10.0 billion, reversing the prior quarter's momentum
- $USDe dropped 24.4% to $4.4 billion, as yield compression pushed returns below the risk-free rate and prompted sUSDS and sUSDe stakers to unstake
- $USD1 grew 5.5%, and the "Others" category rebounded 6.2%, or $1.7 billion
@tether gaining share in a shrinking pool is worth watching. The sector got smaller and more concentrated at the same time.
Where did the activity go?
Prediction markets recorded $113.8 billion in notional volume for the quarter. June alone did $50.7 billion, a 91.9% jump over the $27.5 billion monthly average of the previous five months, and a new all-time high.
The driver is not subtle. A dense sporting calendar landed from late May onward: the UEFA Champions League final, the Stanley Cup, the NBA Finals, Wimbledon, and the FIFA World Cup, which runs to its July 19 final. On Polymarket, sports contracts made up 81% of June volume, up from 40% in January.
The competitive picture shifted with it. @Kalshi extended its lead from 42.4% share in Q1 to 58.9% in Q2, while @Polymarket slid from 35.8% to 30.2%. Rothera, the Robinhood and Susquehanna International Group joint venture that launched in May, reached fourth place by June with $2.1 billion in notional volume, a fast start for a platform with only two months on the clock.
What is really driving tokenized collectibles?
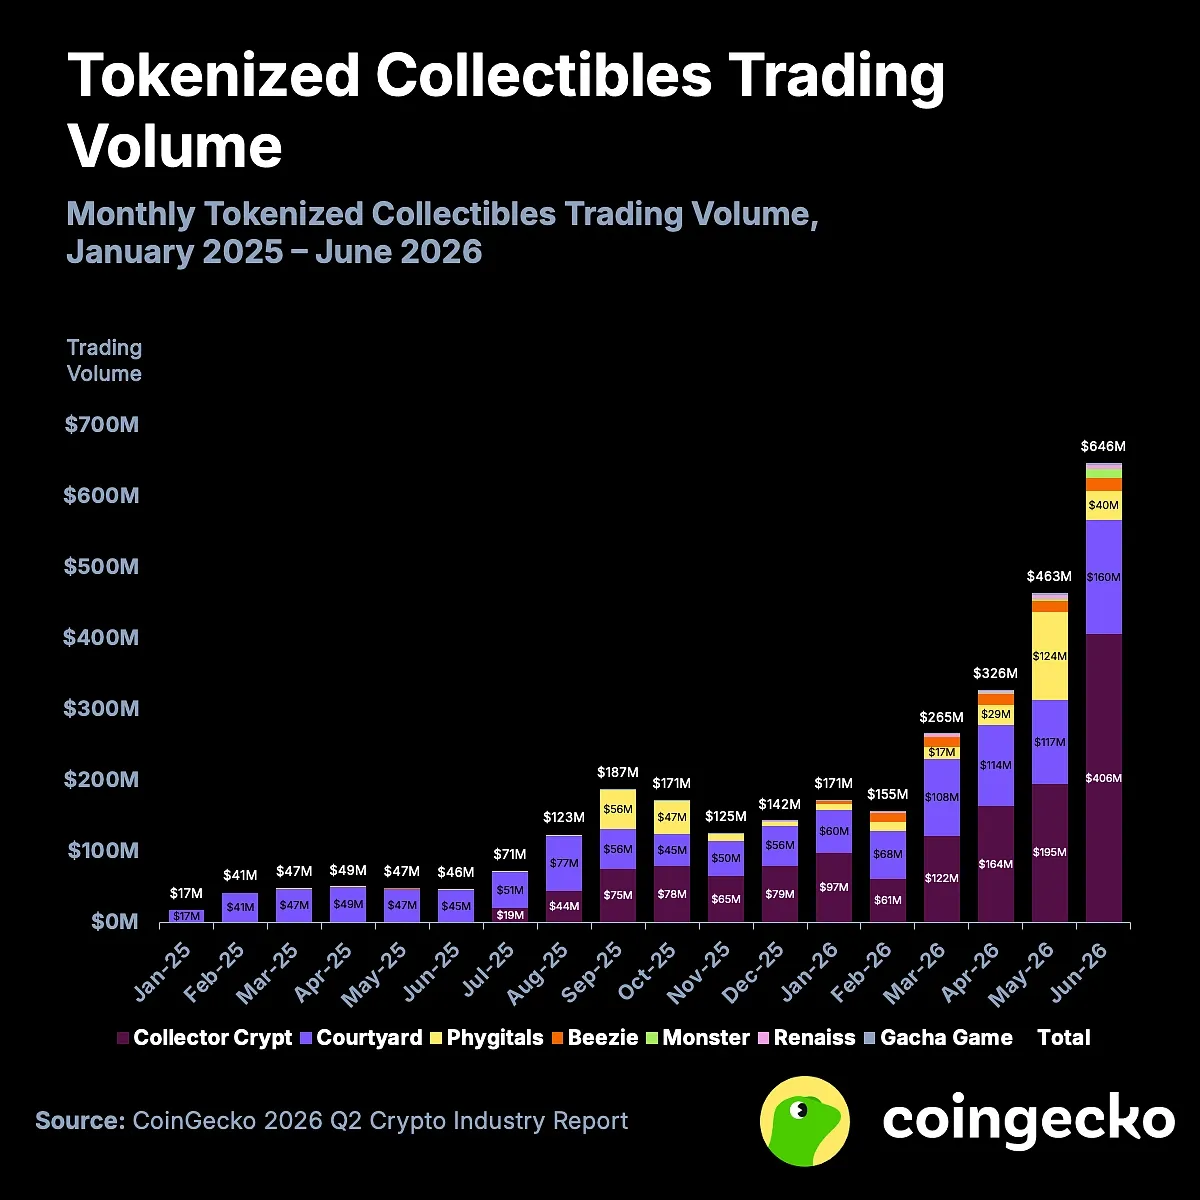
Collector Crypt took 62.8% of tokenized collectibles volume in June, overtaking Courtyard, which dominated the tokenized TCG space through the first half of 2025. Its monthly volume rose 317% from $97 million in January to $406 million in June.
For scale, OpenSea (@opensea) recorded $32.7 million in NFT sales in June 2026. Collector Crypt did more than 12 times that. @Collector_Crypt, @Courtyard_io, and @phygitals are now the largest NFT marketplaces by volume, well ahead of the name most people still associate with the category.
The caveat is large. On average, over 98% of the volume on these platforms comes from gacha mechanisms, where users buy randomized NFT tiers hoping for rare cards, rather than from secondary sales.
How did the exchanges hold up?
Spot volume across the top 10 centralized exchanges fell 27.9% to $1.95 trillion, down from $2.70 trillion in Q1. May set a monthly low of $619.0 billion, with June recovering modestly to $695.0 billion.
The declines ranged from 5% to 56% across venues. @binance extended its dominance to a 38.7% share. Bybit (@Bybit_Official) was the only other exchange in double digits at 10.0%, displacing MEXC, whose volume more than halved from $275.2 billion to $121.2 billion and whose ranking dropped from second to seventh. Crypto(.)com fell 40.9% and KuCoin fell 38.5%.
Perps held up better in relative terms. Top 10 perp CEX volume came in at $12.7 trillion, down 10.0% from $14.1 trillion, with monthly volume staying above $4.0 trillion, still ahead of the average for the first three quarters of 2024. The report attributes the gap to trader preference for perps speculation and growth in RWA perps. Relative market share among the top 10 stayed largely unchanged, with MEXC's April and early-May surge fading by June.
Three quarters into the downtrend, perps volume is contracting at roughly a third of the rate of spot. Binance holds 38.7% of spot trading volume, and Tether holds 60% of the (shrinking) stablecoin pool. Prediction markets set their June record with the World Cup group stage, and gacha accounts for over 98% of the volume on collectibles platforms.
Sources:
- CoinGecko 2026 Q2 Crypto Industry Report, a 58-slide breakdown of market cap, stablecoins, prediction markets, tokenized collectibles, CEX spot and perps activity, DeFi, and DEX performance. Published July 16, 2026.
- CoinGecko Reports archive of previous quarterly and thematic industry reports for quarter-on-quarter comparison.
- CoinGecko Global Charts live total market cap and dominance data.
Read Next...




Disclaimer
Disclaimer: The views expressed in this article do not necessarily represent the views of BSCN. The information provided in this article is for educational and entertainment purposes only and should not be construed as investment advice, or advice of any kind. BSCN assumes no responsibility for any investment decisions made based on the information provided in this article. If you believe that the article should be amended, please reach out to the BSCN team by emailing [email protected].
Author
 Crypto Rich
Rich has been researching cryptocurrency and blockchain technology for eight years and has served as a senior analyst at BSCN since its founding in 2020. He focuses on fundamental analysis of early-stage crypto projects and tokens and has published in-depth research reports on over 200 emerging protocols. Rich also writes about broader technology and scientific trends and maintains active involvement in the crypto community through X/Twitter Spaces, and leading industry events.
(Advertisement)
Latest News
1h : 6m ago

Insights from CoinGecko's Q2 Crypto Report
3h : 21m ago

Why Is Sui's Approach to Storing Data On Chain Different From Most Blockchains?
5h : 36m ago

Why Does XRP Move Faster Than Bitcoin, And What Makes It Possible?
5h : 51m ago

Top 8 Prediction Markets in Crypto Today
July 16, 2026

Grayscale Picks Its Most Promising Tokenization Blockchains
July 16, 2026

Crypto's Top Five Centralized Exchanges
July 16, 2026

How Is Polygon Trying to Connect Every Blockchain Into a Single Network?
July 16, 2026

What Does It Really Mean To Host A Website On The Internet Computer?
(Advertisement)

Crypto Project & Token Reviews
Project & Token Reviews
Comprehensive reviews of crypto's most interesting projects and assets
Learn about the hottest projects & tokens

Latest Crypto Articles
Get up to date with the latest crypto news stories and events