Research
(Advertisement)


BONK Price Set to Flip Bullish? Market Analysis

BONK is showing early signs of trend reversal with key technical breakouts. Learn what recent chart patterns and key levels suggest for its next move.
Miracle Nwokwu
April 29, 2025

(Advertisement)
BONK, Solana’s second-largest memecoin by market capitalization, appears to be shifting gears after a period of extended correction. Since April 22, BONK has climbed over 60%, rising from a low of $0.00001212 to a high of $0.00002179, as recorded on April 28. This rapid upward movement is backed by a notable increase in trading volume and renewed interest among traders and builders.
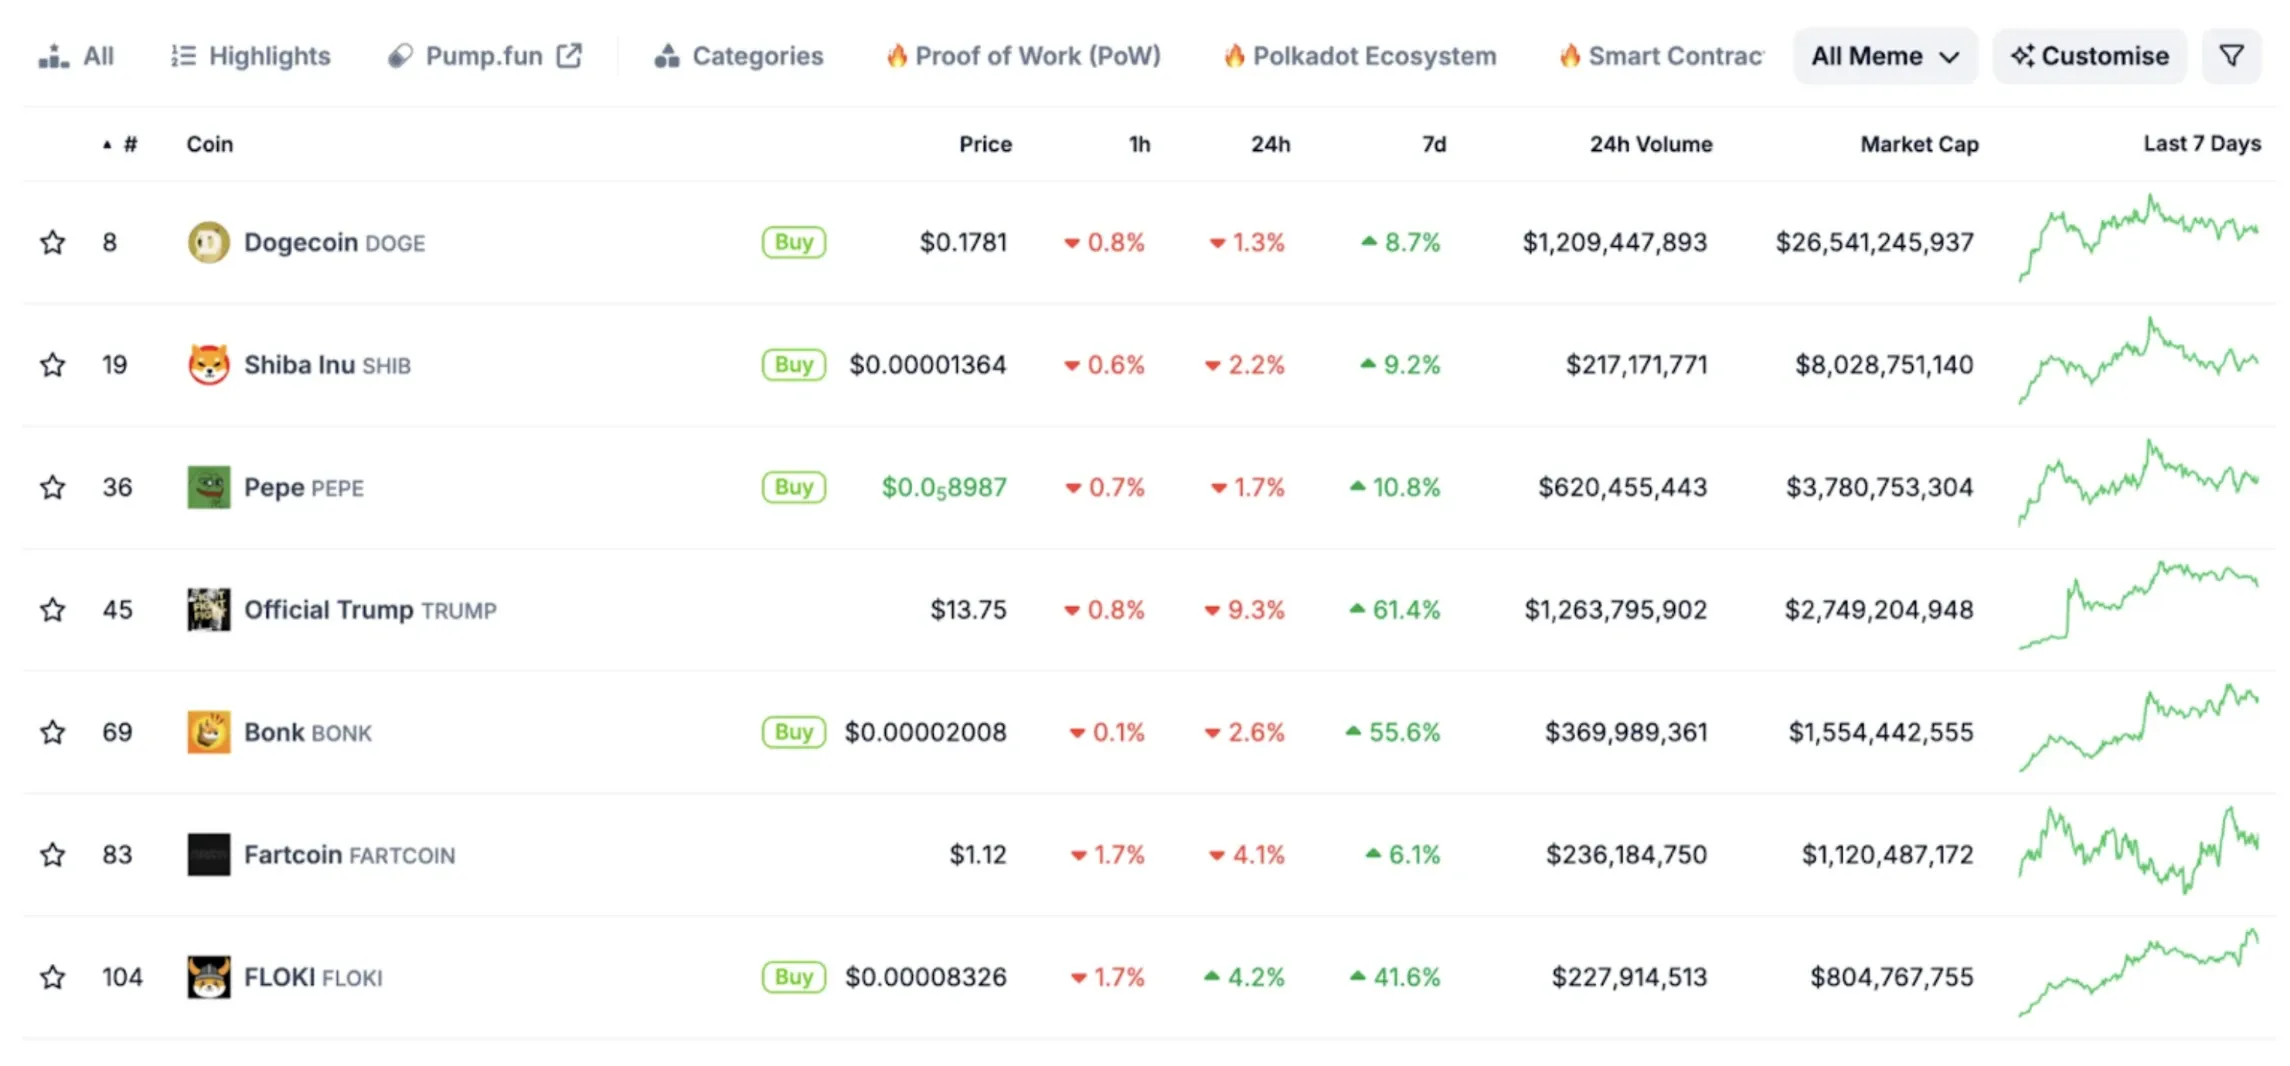
This momentum also mirrors a broader trend across the memecoin sector. Tokens such as TRUMP, PEPE, DOGE, and FLOKI have all posted significant gains in recent days, suggesting that investor appetite for high-volatility, community-driven assets is once again on the rise. BONK’s recent rally may, in part, be benefiting from this sector-wide enthusiasm, as capital flows back into speculative corners of the market.
Below, we break down BONK’s recent price behavior, technical structure, and the key factors that could influence its next move.
Price Performance and Volume Surge
According to Coingecko data, BONK’s trading volume jumped by more than 420% over the past seven days, topping $503 million. This surge in liquidity has pushed BONK’s market capitalization to approximately $1.6 billion. Such volume increases often accompany shifts in market sentiment and can signal the early stages of a trend reversal.
This renewed interest may have been partly driven by the recent launch of LetsBONK.fun, a new launchpad designed to simplify the creation of memecoins on Solana. The platform allows users to deploy tokens without needing advanced technical knowledge. Notably, portions of its fee structure are channeled back into the ecosystem—supporting Solana’s security via the BONKsol validator, funding ongoing development, and enabling BONK token buybacks and burns. These mechanisms could reduce BONK’s circulating supply over time, potentially supporting its price floor in the longer term.
Chart Analysis: Reversal Patterns Emerging
The BONK/USDT price chart below reveals a rounding bottom pattern. This classic formation often indicates a gradual reversal from bearish to bullish territory and is typically seen at the end of prolonged downtrends.
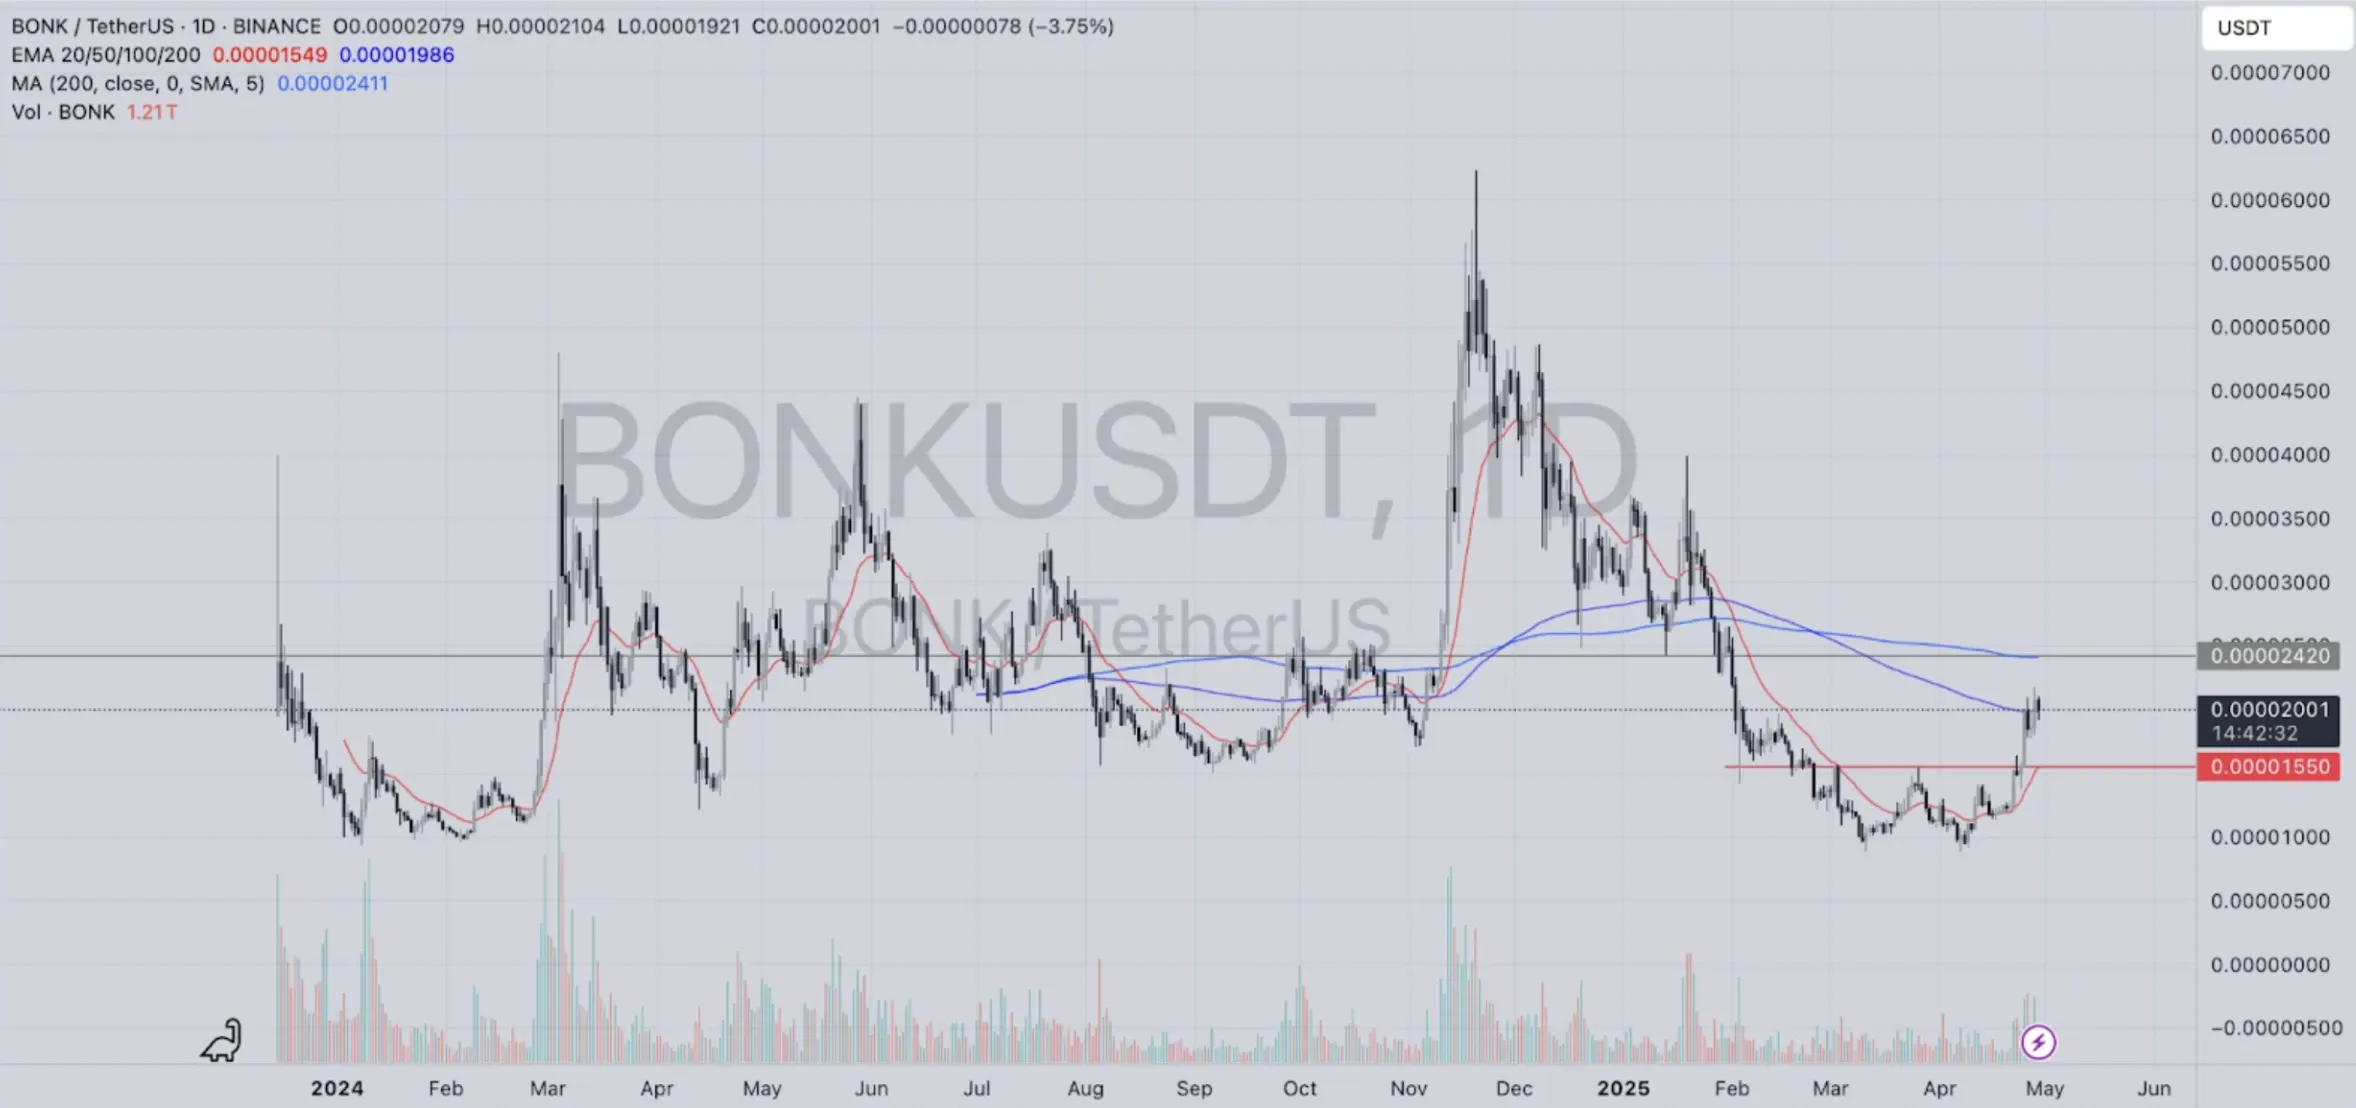
After reaching an all-time high of $0.000062 on November 20, 2024, BONK experienced a significant decline followed by a series of consolidations. This downward trajectory appears to be stabilizing, with recent price action forming a smooth U-shape—characteristic of a rounding bottom.
Currently, BONK has broken above the 200-day exponential moving average (EMA), a key technical indicator that often acts as dynamic support or resistance. Sustained trading above this level is often interpreted as a sign that buyers are regaining control.
Watching Key Levels: MA Resistance and Inverse Head & Shoulders
While momentum is picking up, traders should monitor the area around $0.00002411 carefully. This zone aligns with both the 200-day moving average (DMA) and the potential neckline of an emerging inverse Head and Shoulders (H&S) pattern—a structure that often precedes bullish breakouts but can include a short-term pullback before continuation.
Should BONK retrace to the $0.00001550 range, this may present a more favorable entry point for traders looking for confirmation of support. A bounce from that region, combined with rising volume, would strengthen the bullish case.
However, failure to hold recent support levels could result in a retest of prior lows. A close below $0.000017 could invalidate the bullish thesis in the short term and reintroduce downward pressure.
Outlook: Cautious Optimism
BONK's technical structure is improving, supported by growing volume, a favorable chart pattern, and a push above major EMAs. If price breaks cleanly above $0.00002411 with volume confirmation, it could open the door to a move toward the next resistance zone around $0.00003.
Traders and investors should remain aware of broader market conditions and watch for price action near key EMAs. The interplay between short-term pullbacks and long-term trend reversals will likely define BONK’s trajectory over the coming weeks.
For now, BONK shows early signs of a bullish flip—but as always, confirmation is key.
This analysis is intended for educational purposes only and does not constitute financial advice. Always conduct your own research before making any investment decisions.
Read Next...


Disclaimer
Disclaimer: The views expressed in this article do not necessarily represent the views of BSCN. The information provided in this article is for educational and entertainment purposes only and should not be construed as investment advice, or advice of any kind. BSCN assumes no responsibility for any investment decisions made based on the information provided in this article. If you believe that the article should be amended, please reach out to the BSCN team by emailing [email protected].
Author
 Miracle Nwokwu
Miracle holds undergraduate degrees in French and Marketing Analytics and has been researching cryptocurrency and blockchain technology since 2016. He specializes in technical analysis and on-chain analytics, and has taught formal technical analysis courses. His written work has been featured across multiple crypto publications including The Capital, CryptoTVPlus, and Bitville, in addition to BSCN.
(Advertisement)
Latest News
July 10, 2026

How Do PancakeSwap's CAKE Token Burns Actually Work?
July 10, 2026

Report: Ripple & The XRP Ecosystem in H1 2026
July 10, 2026

How Is Cardano Advancing Financial Inclusion in Developing Countries?
July 10, 2026

Why Was Sui Built From Scratch Instead of Forking an Existing Blockchain?
July 9, 2026

Trust Wallet Adds Native Support for Robinhood Chain, Opening Stock Tokens to 220 Million Users
July 9, 2026
Robinhood Chain Explodes Post-Mainnet Launch
July 9, 2026

Is Avalanche AVAX Bringing Hyundai On Chain?
July 9, 2026

Stop Tokenizing Assets You Don't Control
(Advertisement)

Crypto Project & Token Reviews
Project & Token Reviews
Comprehensive reviews of crypto's most interesting projects and assets
Learn about the hottest projects & tokens
Latest Crypto Articles
Get up to date with the latest crypto news stories and events