Research
(Advertisement)


Why is XRP Price Down Today? 40% Crash Ahead?
XRP faces downside risks as bearish patterns emerge. A failure to hold $2 support may lead to further declines. Will the trend reverse soon?
Miracle Nwokwu
March 27, 2025

(Advertisement)
Ripple's XRP has struggled this past week, underperforming compared to gains seen in major cryptocurrencies like Bitcoin, Ethereum, BNB, and SOL. Currently priced at $2.37, XRP has dropped over 5% in the last seven days, with a significant 3.4% slide within the past 24 hours, according to data from Coingecko.
This decline has interrupted XRP’s rally, which began on March 19 after the news about Ripple’s settlement with the SEC. As part of the agreement, Ripple will pay $50 million of the original $125 million fine levied by the SEC. Additionally, the SEC plans to ask the court to lift the earlier injunction against Ripple, although the final steps in the process are still underway.
XRP's trading volume has also fallen sharply, dropping from over $4 billion to $2.9 billion in the past week—a decrease of more than 39%.
XRP/USDT Chart Analysis
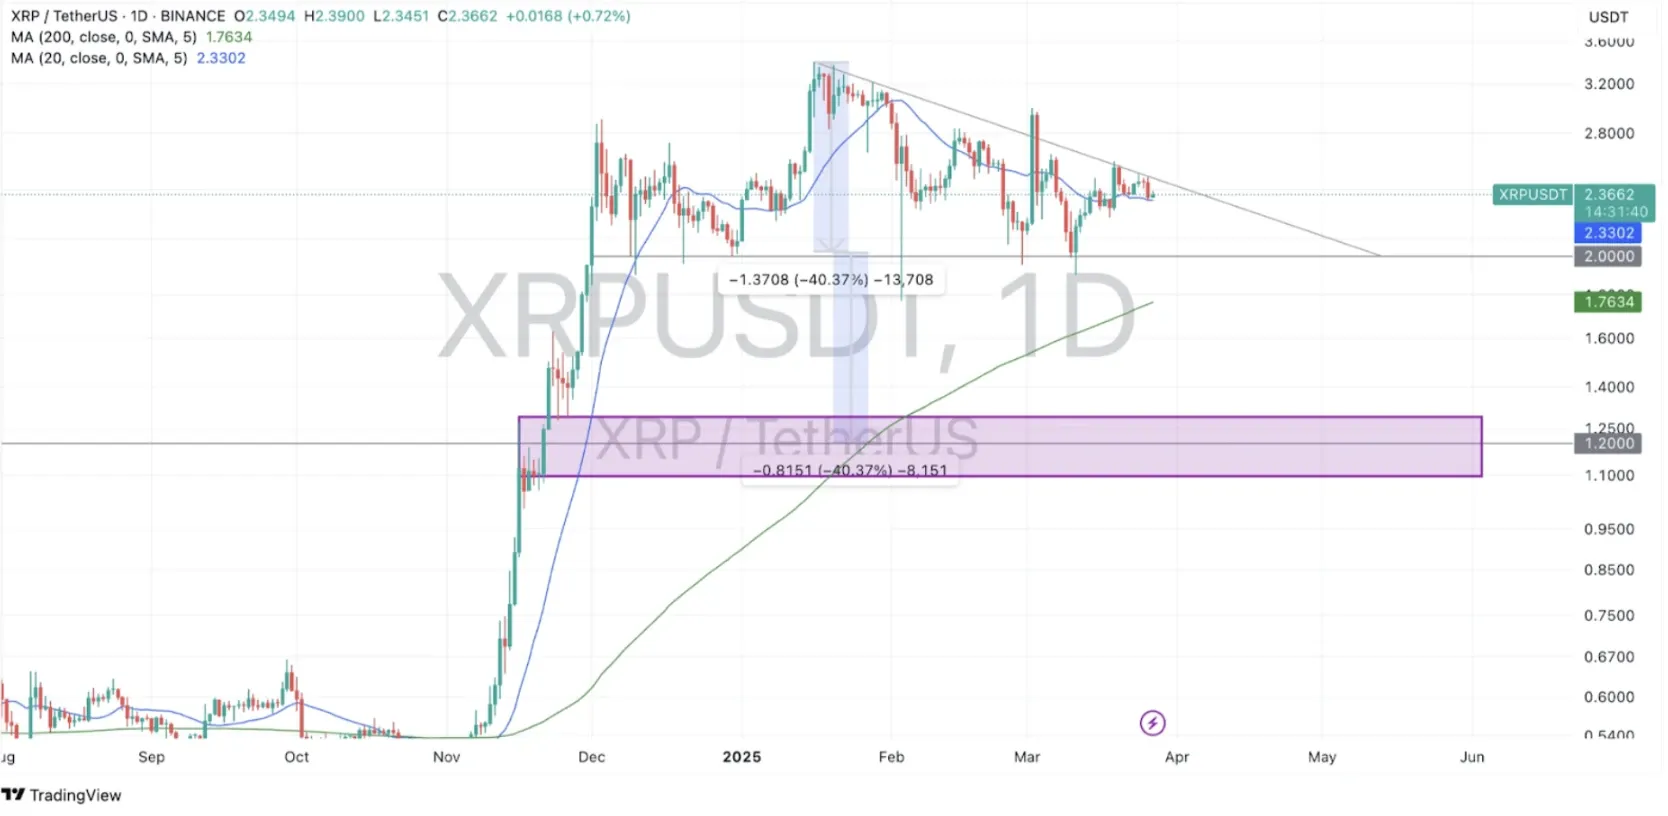
Analyzing the daily XRP/USDT chart reveals two concerning bearish patterns: a head and shoulders (H&S) formation and a descending triangle. Both suggest potential downside risks for XRP. While an H&S pattern is often dependable for predicting price movements, it could still be invalidated if XRP manages to break above $3.
The left shoulder formed in late December 2024, with XRP peaking near $2.80 before retreating. The "head," which is the highest point of the pattern, reached approximately $3 in early January 2025, followed by another drop. Since February, XRP has tested the $2 region at least three times, rebounding quickly from this key support level, as shown by the candle wicks.
Currently, XRP is trading above the 20-day moving average (MA). However, a pattern of lower highs, declining trading volumes, and resistance around the upper trendline of the descending triangle suggest caution is warranted for buyers.
If XRP fails to hold the $2 support level during its next retest, there’s a possibility of a 40% decline, potentially sliding to $1.20. However, the $1.76 zone, which aligns with the 200-day moving average, may offer some support for buyers.
A confirmed completion of the bearish pattern could signal a longer-term downward trend for XRP. This would indicate that sellers are gaining control after buyers failed to sustain higher price levels.
Based on the current market structure, it’s still a bit early to predict heavy declines for XRP. However, the lower highs and inverse movement against the general market trend should be a cause for concern. XRP would need to quickly reclaim the $2.50 levels, an area that will push it above the upper triangle trendline and crucial resistance, shifting momentum in favor of buyers.
Read Next...


Disclaimer
Disclaimer: The views expressed in this article do not necessarily represent the views of BSCN. The information provided in this article is for educational and entertainment purposes only and should not be construed as investment advice, or advice of any kind. BSCN assumes no responsibility for any investment decisions made based on the information provided in this article. If you believe that the article should be amended, please reach out to the BSCN team by emailing [email protected].
Author
 Miracle Nwokwu
Miracle holds undergraduate degrees in French and Marketing Analytics and has been researching cryptocurrency and blockchain technology since 2016. He specializes in technical analysis and on-chain analytics, and has taught formal technical analysis courses. His written work has been featured across multiple crypto publications including The Capital, CryptoTVPlus, and Bitville, in addition to BSCN.
(Advertisement)
Latest News
July 10, 2026

How Do PancakeSwap's CAKE Token Burns Actually Work?
July 10, 2026

Report: Ripple & The XRP Ecosystem in H1 2026
July 10, 2026

How Is Cardano Advancing Financial Inclusion in Developing Countries?
July 10, 2026

Why Was Sui Built From Scratch Instead of Forking an Existing Blockchain?
July 9, 2026
Trust Wallet Adds Native Support for Robinhood Chain, Opening Stock Tokens to 220 Million Users
July 9, 2026
Robinhood Chain Explodes Post-Mainnet Launch
July 9, 2026

Is Avalanche AVAX Bringing Hyundai On Chain?
July 9, 2026

Stop Tokenizing Assets You Don't Control
(Advertisement)

Crypto Project & Token Reviews
Project & Token Reviews
Comprehensive reviews of crypto's most interesting projects and assets
Learn about the hottest projects & tokens
Latest Crypto Articles
Get up to date with the latest crypto news stories and events