Research
(Advertisement)


Telcoin Mirrors Market Slide as Downtrend Deepens, Key Support Now in Focus

TEL has struggled to recover this year, trading below major averages as overall crypto market weakness continues to weigh on price.
Miracle Nwokwu
January 31, 2026

(Advertisement)
Telcoin (TEL) has moved in near lockstep with Bitcoin’s latest market slump, extending its own multi-week downtrend as risk appetite fades across the crypto market. Since the start of the year, TEL has struggled to sustain any meaningful recovery, with price action reflecting the broader weakness seen in large-cap assets. The result is a chart structure that remains technically fragile, though not without potential turning points.
From early January to date, TEL has continued trading inside a descending channel that has defined price behavior since December. Each bounce has produced a lower high, while successive selloffs have carved out lower lows; a classic bearish structure. Attempts to push above short-term moving averages have repeatedly failed, signaling that sellers remain active on strength rather than capitulating.
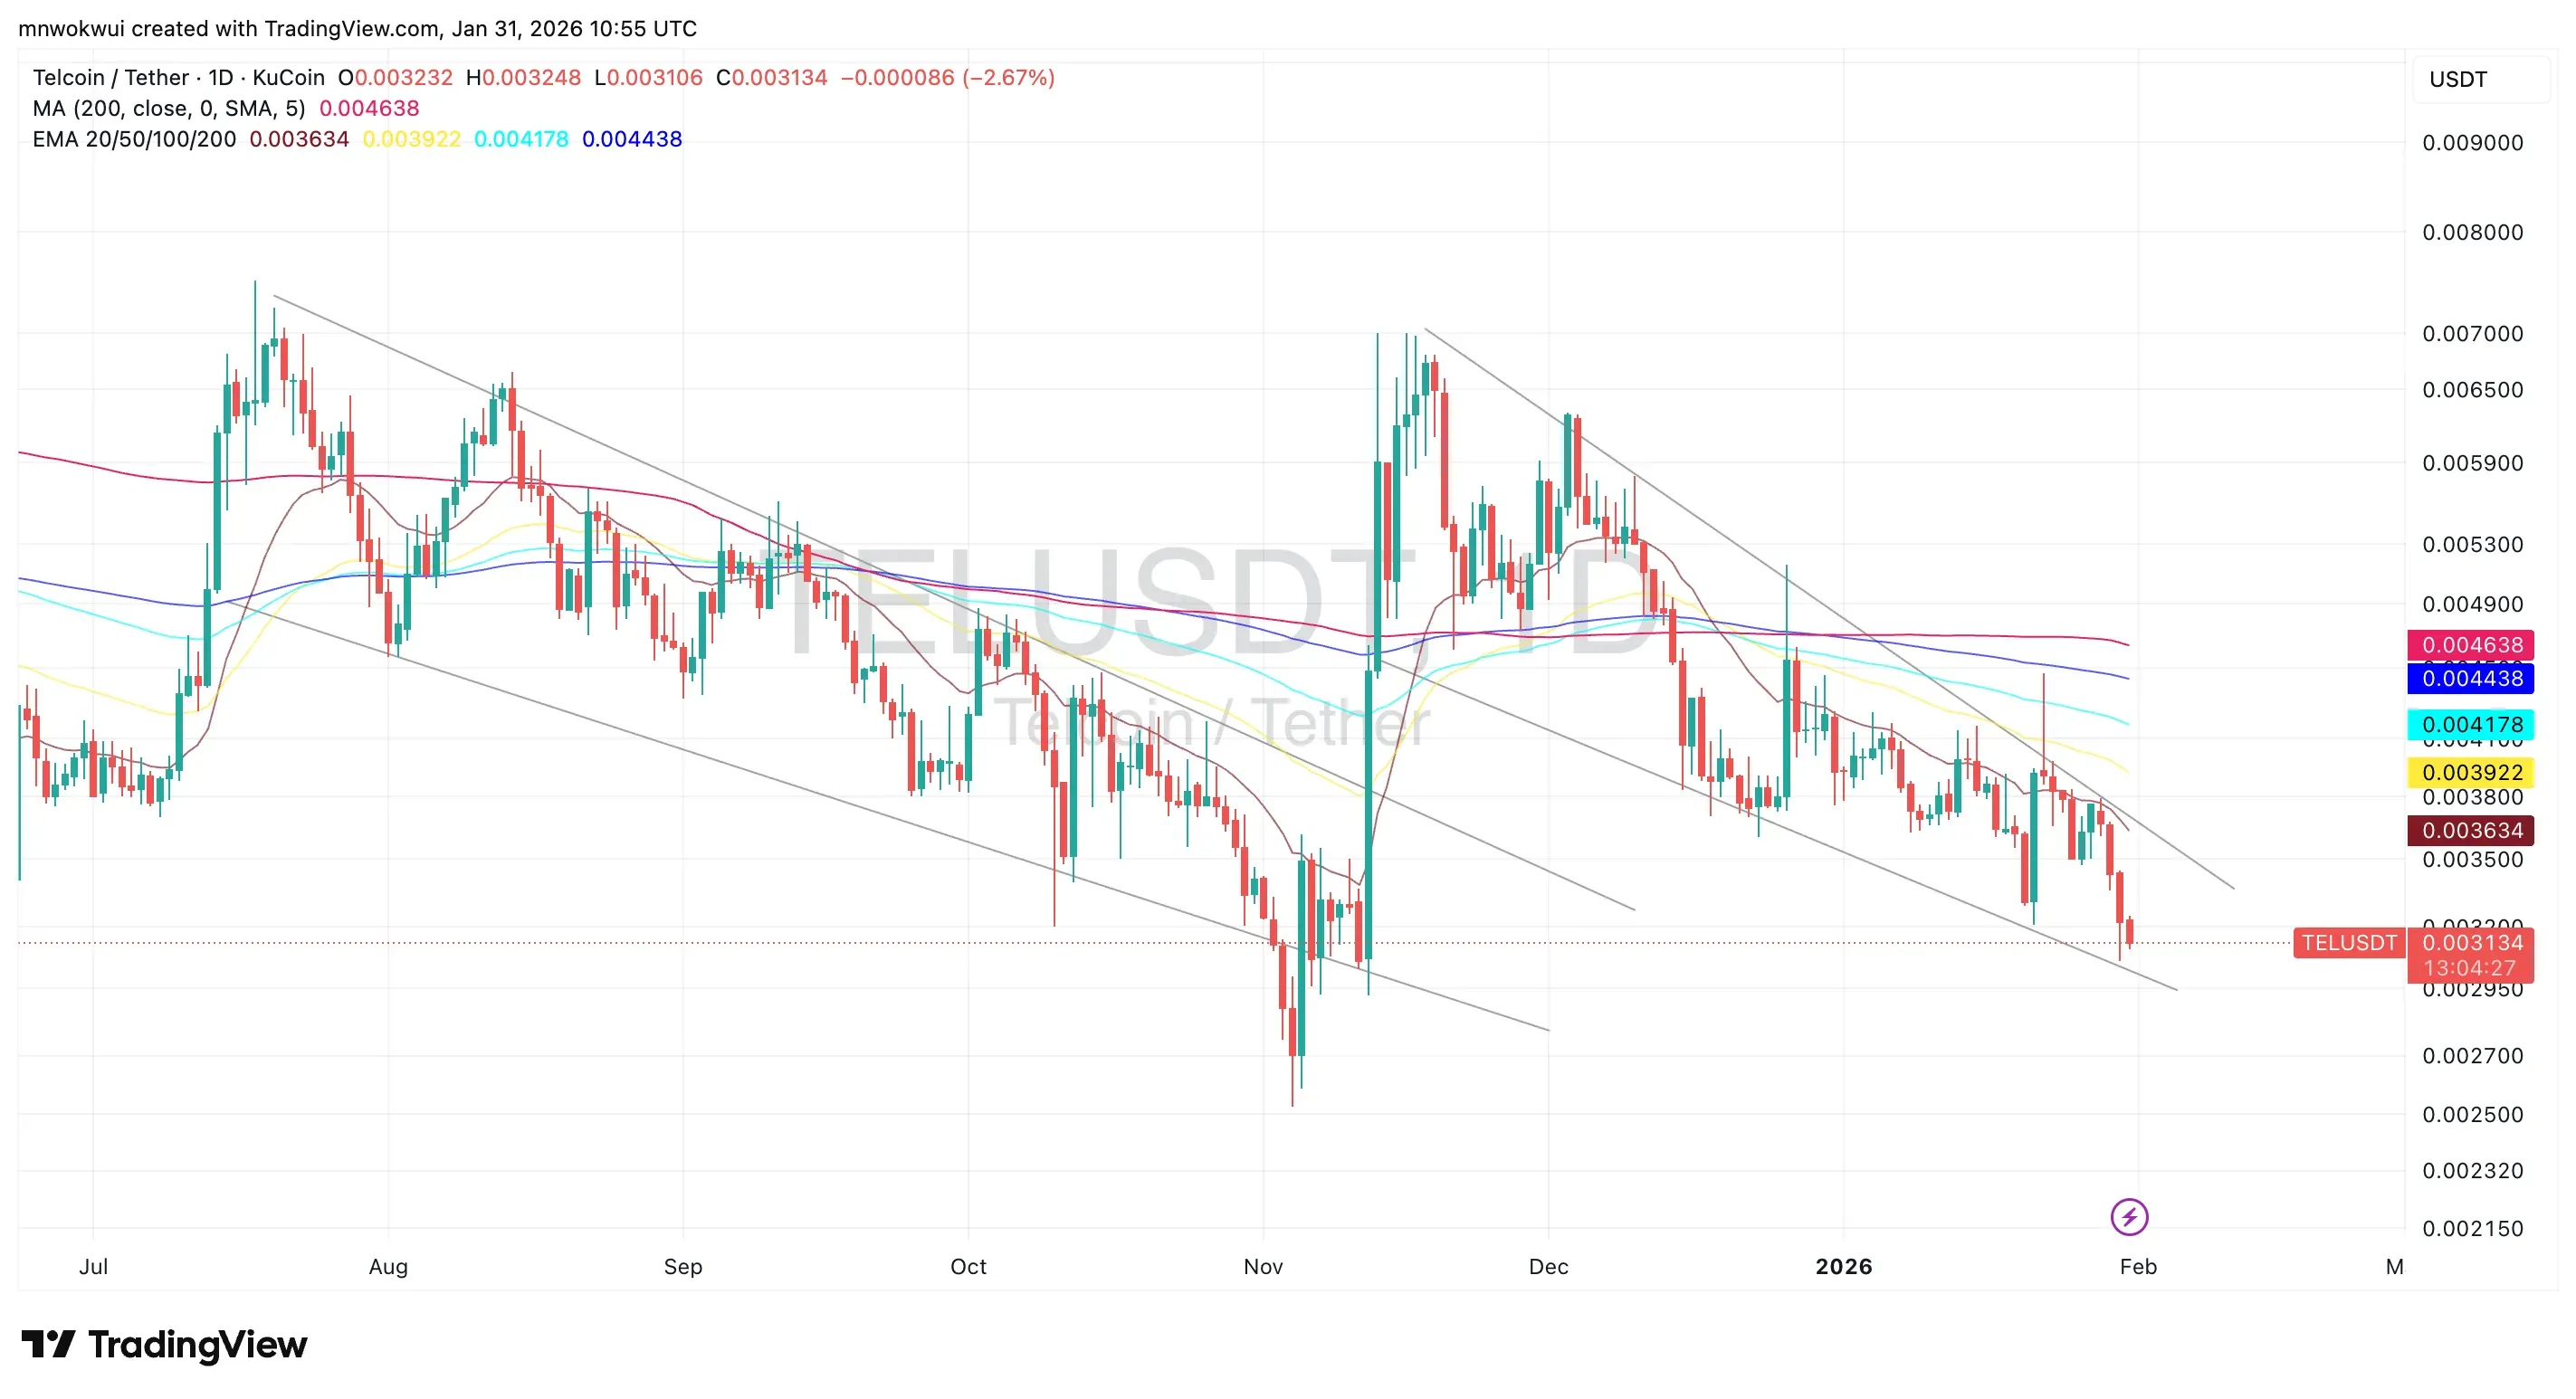
The token is currently trading below its 20-day, 50-day, 100-day, and 200-day moving averages, a strong indication that both short- and long-term momentum favor the downside. Notably, the 200-day moving average sits well above current price levels, underscoring how far TEL has drifted from its broader trend baseline. The clustering of shorter EMAs above price also acts as dynamic resistance, meaning any recovery faces layered technical hurdles.
Volume patterns reinforce this cautious outlook. Rallies through January have lacked strong follow-through, while selloffs have shown sharper, more decisive candles. This asymmetry suggests that market participants are quicker to exit positions than to initiate new long exposure — typical behavior during corrective phases.
Bearish scenario
If current conditions persist, TEL risks extending its slide toward the lower boundary of the descending channel, which has been guiding price lower for weeks. A decisive breakdown below recent swing lows near the psychological $0.003 region would likely accelerate downside momentum. Such a move could open the door toward the mid-to-high $0.002 range, an area that previously acted as a volatility pivot during late 2025.
Failure to reclaim at least the 20-day and 50-day EMAs on a closing basis would keep the trend firmly bearish. In this scenario, any short-term bounce may be viewed as a relief rally within a broader downtrend rather than the start of a sustained reversal. Continued Bitcoin weakness would add further pressure, given TEL’s recent correlation with the broader market.
Bullish scenario
Despite the negative structure, the chart is approaching zones where mean-reversion bounces become more probable. Price is testing the lower channel boundary and a historical support area that has previously attracted buyers. If TEL can hold this region and form higher lows on shorter timeframes, it could signal that selling pressure is beginning to exhaust.
A bullish shift would first require a clean break above the 20-day EMA, followed by a push through the 50-day EMA. That would mark the first meaningful improvement in short-term structure since the year began. From there, the next key test would be the cluster around the $0.0043–$0.0046 region, where the 100-day and 200-day moving averages converge with prior support-turned-resistance.
A move above that zone, especially on rising volume, would invalidate the descending channel and suggest that TEL is transitioning from a downtrend into a consolidation or early recovery phase.
For now, however, the technical picture leans bearish. Traders will be watching whether current support can stabilize price, or whether TEL continues to mirror Bitcoin’s weakness with another leg lower.
Read Next...


Disclaimer
Disclaimer: The views expressed in this article do not necessarily represent the views of BSCN. The information provided in this article is for educational and entertainment purposes only and should not be construed as investment advice, or advice of any kind. BSCN assumes no responsibility for any investment decisions made based on the information provided in this article. If you believe that the article should be amended, please reach out to the BSCN team by emailing [email protected].
Author
 Miracle Nwokwu
Miracle holds undergraduate degrees in French and Marketing Analytics and has been researching cryptocurrency and blockchain technology since 2016. He specializes in technical analysis and on-chain analytics, and has taught formal technical analysis courses. His written work has been featured across multiple crypto publications including The Capital, CryptoTVPlus, and Bitville, in addition to BSCN.
(Advertisement)
Latest News
July 15, 2026

REAL Joins Blockchain for Europe to Shape EU Tokenisation Rules
July 15, 2026

Which Crypto Companies and Protocols Make The Most Money?
July 15, 2026

How SBI Built Japan's Largest Crypto Business
July 15, 2026

Elon Musk And Dogecoin: How One Man Shaped A Memecoin’s Price And Reputation
July 15, 2026
DTCC Tokenization Platform: How Does Wall Street's Blockchain Pilot Actually Work?
July 14, 2026

Report: Cardano's Biggest Updates from H1 2026
July 14, 2026

What is an XDC Network Masternode Validator?
July 13, 2026

Telebiz Goes Live With an Open-Source CRM Built Directly Into Telegram
(Advertisement)

Crypto Project & Token Reviews
Project & Token Reviews
Comprehensive reviews of crypto's most interesting projects and assets
Learn about the hottest projects & tokens
Latest Crypto Articles
Get up to date with the latest crypto news stories and events