News
(Advertisement)


How Low Can Bitcoin Go From Here?

A clear analysis of how low Bitcoin price can go, key support levels, technical signals, MACD and RSI readings, and recent expert commentary for traders.
Soumen Datta
February 4, 2026

(Advertisement)
Table of Contents
Bitcoin can still fall further from current levels near $76,000. Based on the daily chart, momentum indicators, and recent expert analysis, the most realistic downside range sits between $74,000 and $70,000, with deeper levels only coming into play if selling pressure accelerates.
The $78,000 level has already been lost and flipped into resistance. The market is no longer deciding whether support will hold. It is now searching for demand below current prices.
What Does The Daily Bitcoin Chart Show Right Now?
The one-day Bitcoin chart shows a clear breakdown from a multi-month range.
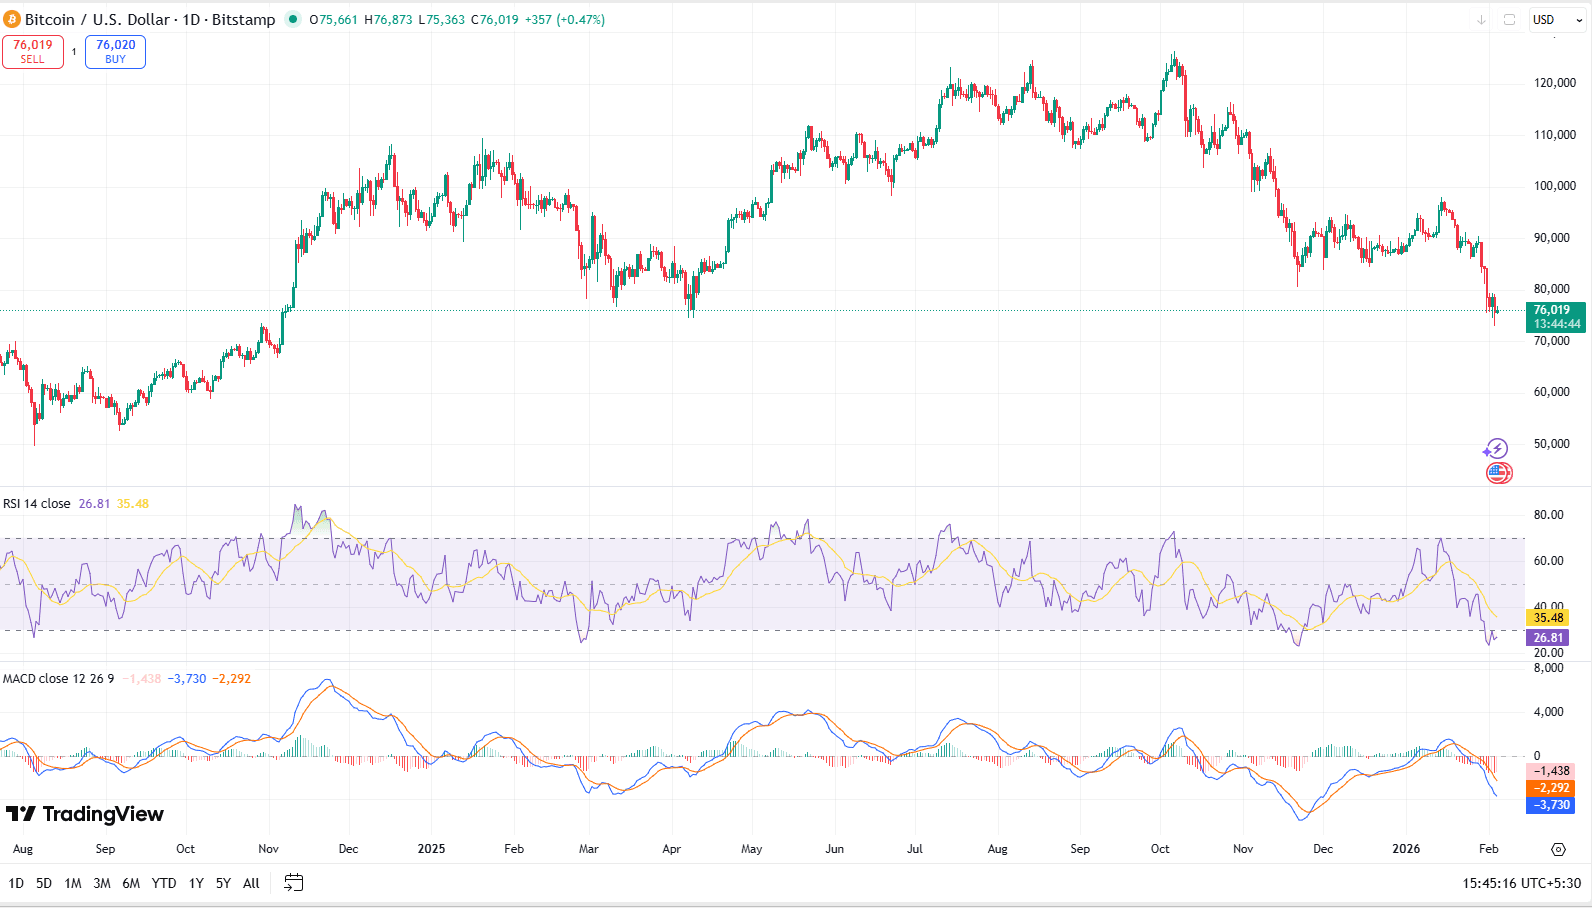
Price is trading below prior consolidation zones and well under recent swing highs. The structure is lower highs and lower lows, which defines a downtrend on the daily timeframe.
Momentum indicators confirm this weakness.
• RSI (14-day) is near 26, which signals oversold conditions
• MACD is deeply negative, with no bullish crossover in sight
• Selling candles show follow-through rather than sharp rejection
Oversold does not mean bottom. In strong downtrends, Bitcoin has historically stayed oversold for weeks before finding a durable low.
Where Are The Key Support Levels Below $76,000?
Bitcoin is now trading in a zone where buyers must step in to slow further downside.
The most important levels on the chart are:
• $74,000–$75,000: Previous demand zone from earlier consolidation
• $70,000–$72,000: Psychological support and prior range lows
• $65,000: Low probability but visible from prior cycle structure
The $74,000 area is the first place where a reaction is likely. If that level fails on a daily close, the path toward $70,000 opens quickly due to thin liquidity.
Why Has $78,000 Become A Key Resistance?
$78,000 was a major pivot earlier in the trend. Once Bitcoin closed below it, that level stopped acting as support.
This is a classic market behavior.
• Former support turns into resistance
• Bounces toward that level attract sellers
• Failed retests confirm trend continuation
Until Bitcoin reclaims $78,000 on a daily close, rallies should be treated as corrective, not trend-changing.
What Analysts Are Saying
Recent expert remarks align with the technical read.
• Analysts from QCP Capital warn that recent dips below key supports could lead to deeper corrections, citing fragile macro momentum and weaker price structure.
• A strategist from Zacks Investment Research has suggested that if current trends persist, Bitcoin could revisit as low as $40,000, a near 49% drop from present levels.
• Michael Burry outlined scenarios where if price dropped below $70,000 and proceeded toward $60,000 or $50,000, broader market stress could follow in related sectors.
These outlooks cover a broad range because technical analysis and macro factors can vary quickly. The most likely path still centers on support zones above $70,000, but deeper declines can’t be ruled out in a sustained bear environment.
What Could Cause Further Downside?
Several factors can push Bitcoin lower:
• Macro uncertainty affecting risk assets.
• ETF flows reversing from net buyers to net sellers.
• Lower institutional demand and reduced liquidity.
• Breakdowns of key support levels triggering stop-loss cascades.
CryptoQuant research suggests a new bear phase may have begun, with Bitcoin potentially testing $70,000 over the next few months and even a drop toward $56,000 in extreme cases. (AInvest)
What Would Invalidate The Downside Case?
The bearish scenario would weaken or reverse if Bitcoin:
• Climbs back above major resistance near $80,000–$85,000 with conviction and volume.
• RSI moves above mid-50 levels, supported by stronger MACD momentum.
• Daily closes settle above falling moving averages.
If these conditions emerge, the risk of deeper downside falls significantly and the market could shift to a consolidation or recovery phase.
Conclusion
Right now, Bitcoin’s technical posture remains bearish. Based on expert analysis and the latest price structure, Bitcoin could test as low as the mid-$70,000 region and potentially the low $70,000s if key supports break. A more severe bear market could see deeper levels such as $60,000 or even $40,000 in extreme liquidation environments, but these are lower-probability outcomes given current data.
Price action in the coming days will be crucial. A breach of the $78,000 and $74,000 support zones would signal expanded downside risk, while sustained support around those levels could stabilize the market.
Resources
Bitcoin on TradingView: Bitcoin price action
Report by The Block: CryptoQuant says bear market has started, sees bitcoin downside risk to $70,000
Report by Business Insider: 3 reasons a strategist thinks bitcoin could plunge to $40,000 — and why the crypto winter could drag on for months to come
QCP report: Market Insights
Report by Decrypt: Bitcoin Risks Further Slide as Momentum Weakens Below Key Support
Read Next...


Frequently Asked Questions
How low can Bitcoin realistically go from here?
On the downside, key levels between $74,000 and $70,000 are realistic near-term targets. More extreme scenarios suggest deeper declines toward $60,000 or $40,000 if selling intensifies.
What technical indicators show the most risk for further declines?
Bitcoin’s RSI in oversold territory and a bearish MACD on the daily chart signal ongoing downward momentum. Continued breakdowns of support levels also point to increased risk.
Can Bitcoin bounce before reaching these lows?
Yes. Oversold conditions often lead to short-term relief rallies toward resistance zones near $80,000–$85,000, especially if buyers step in at key demand levels.
Disclaimer
Disclaimer: The views expressed in this article do not necessarily represent the views of BSCN. The information provided in this article is for educational and entertainment purposes only and should not be construed as investment advice, or advice of any kind. BSCN assumes no responsibility for any investment decisions made based on the information provided in this article. If you believe that the article should be amended, please reach out to the BSCN team by emailing [email protected].
Author
 Soumen Datta
Soumen has been a crypto researcher since 2020 and holds a master’s in Physics. His writing and research has been published by publications such as CryptoSlate and DailyCoin, as well as BSCN. His areas of focus include Bitcoin, DeFi, and high-potential altcoins like Ethereum, Solana, XRP, and Chainlink. He combines analytical depth with journalistic clarity to deliver insights for both newcomers and seasoned crypto readers.
(Advertisement)
Latest News
July 15, 2026

REAL Joins Blockchain for Europe to Shape EU Tokenisation Rules
July 15, 2026

Which Crypto Companies and Protocols Make The Most Money?
July 15, 2026

How SBI Built Japan's Largest Crypto Business
July 15, 2026

Elon Musk And Dogecoin: How One Man Shaped A Memecoin’s Price And Reputation
July 15, 2026
DTCC Tokenization Platform: How Does Wall Street's Blockchain Pilot Actually Work?
July 14, 2026

Report: Cardano's Biggest Updates from H1 2026
July 14, 2026

What is an XDC Network Masternode Validator?
July 13, 2026

Telebiz Goes Live With an Open-Source CRM Built Directly Into Telegram
(Advertisement)

Crypto Project & Token Reviews
Project & Token Reviews
Comprehensive reviews of crypto's most interesting projects and assets
Learn about the hottest projects & tokens
Latest Crypto Articles
Get up to date with the latest crypto news stories and events