News
(Advertisement)


Bitcoin's Worst Weekend Since 2022: Why Prices Crashed to $75,000

Bitcoin crashed to $75,000, losing $800 billion in market value amid geopolitical tensions, liquidations, and thin liquidity. Here's what happened.
Soumen Datta
February 2, 2026

(Advertisement)
Table of Contents
Bitcoin plunged to $75,000 over the weekend, marking its worst performance since the 2022 crypto winter. The cryptocurrency erased roughly $800 billion in market value from its October peak above $126,000, dropping it out of the global top 10 assets for the first time in years.
The selloff forced nearly $2.5 billion in leveraged positions to close and saw bitcoin fall behind traditional heavyweights like Tesla and Saudi Aramco in market rankings. This wasn't an isolated event. Gold dropped 9% to $4,900, while silver suffered a historic 26% crash to $85.30 in the same period.
What Triggered Bitcoin's Weekend Collapse?
The immediate catalyst came from escalating military tensions between the U.S. and Iran on Saturday. When geopolitical risks spike, investors typically shift capital into the U.S. Dollar through what traders call a "flight to safety." Bitcoin, operating 24/7, became the market's first casualty during thin weekend liquidity.
The dollar's strength was amplified by Kevin Warsh's nomination to lead the Federal Reserve. This nomination drove a massive rally in the U.S. Dollar, making dollar-priced assets like bitcoin, gold, and silver more expensive for international buyers. The result was a coordinated selloff across all hard assets, debunking the narrative that crypto alone was facing pressure.
Weekend liquidity remained unusually thin following an October 10 crash that many traders attribute to issues at major exchanges. Market depth, which measures the capital available to absorb large trades, is still more than 30% below its October peak according to Kaiko data. Order books have not fully rebuilt, and the spread between buy and sell prices remains wider than normal.
How Technical Breakdown Accelerated The Decline
Bitcoin's price action on Saturday revealed a market structure under severe stress. The cryptocurrency failed to hold support at $82,500, a level that technical analysts had identified as critical. This breakdown triggered additional selling as algorithmic trading systems and manual traders alike recognized the breach.
The price broke through an ascending trendline that had been in place since late December. More importantly, bitcoin fell below its 50-day exponential moving average, currently near $75,500. This moving average now acts as resistance rather than support, a bearish development that typically signals further downside pressure.
For the first time since October 2023, bitcoin lost its realized market value of $80,700. This metric represents the average cost basis for all bitcoin currently held, essentially the collective "break-even" point for bitcoin holders. Trading below this level puts the majority of market participants underwater on their positions, increasing the likelihood of panic selling.
The Role Of Forced Liquidations In Market Panic
Leveraged trading positions created a cascading effect that accelerated bitcoin's decline. When prices began falling, exchanges automatically closed positions that no longer had sufficient collateral, a process called liquidation. According to Coinglass data, over $850 million in long positions (bets that prices would rise) were wiped out in the initial hours on Saturday.
This figure eventually climbed to nearly $2.5 billion as the selloff gained momentum. Nearly 200,000 traders had their accounts liquidated across various exchanges. These forced sales created a domino effect where liquidations pushed prices lower, triggering additional liquidations in a self-reinforcing cycle.
The derivatives market structure made this worse. Traders who borrowed money to amplify their returns hit "trap doors" where exchanges automatically sold their holdings. Each wave of forced selling found fewer buyers willing to step in, particularly during weekend hours when institutional traders are offline.
Why Are Whales Buying While Retail Investors Flee?
Wallet data from Glassnode reveals a stark divide in market behavior. Small holders controlling less than 10 bitcoin have been consistently selling for over a month. This group, often referred to as retail investors, is capitulating after watching prices fall 35% from the $126,000 all-time high.
Meanwhile, mega-whales holding 1,000 or more bitcoin have quietly accumulated coins. This cohort has increased its holdings to levels not seen since late 2024, effectively absorbing the supply that panicked sellers are dumping. However, their purchases have not been large enough to support prices or reverse the downtrend.
This pattern mirrors previous market cycles where retail participants exit near local bottoms while large holders accumulate. The difference in behavior often reflects different time horizons and risk tolerance between these groups.
Did Michael Saylor's Strategy Position Worsen The Selloff?
Strategy's bitcoin holdings became a focal point when prices briefly dropped below the company's average cost basis of $76,037. The company holds over 700,000 bitcoin, making it the largest institutional holder. Panic spread across social media that Saylor might be forced to sell, which would have devastated an already fragile market.
However, none of Strategy's bitcoin is pledged as collateral, meaning there is no forced selling scenario. The real impact is on the company's ability to raise cheap capital for additional purchases. Strategy's stock price has fallen nearly 70% from its July 2024 high of $455 to current levels around $143, making it more expensive to issue new shares or debt.
This situation matters because Strategy has been one of the market's most consistent buyers. Without this institutional demand, the market loses a significant source of buying pressure, leaving it vulnerable to further liquidations and profit-taking.
What Does The Technical Picture Tell Us?
The daily chart reveals bitcoin in clear bearish territory. The Relative Strength Index (RSI) sits at 21.50, well below the 30 threshold that typically indicates oversold conditions. However, oversold readings can persist during strong downtrends, and RSI alone doesn't guarantee a reversal.
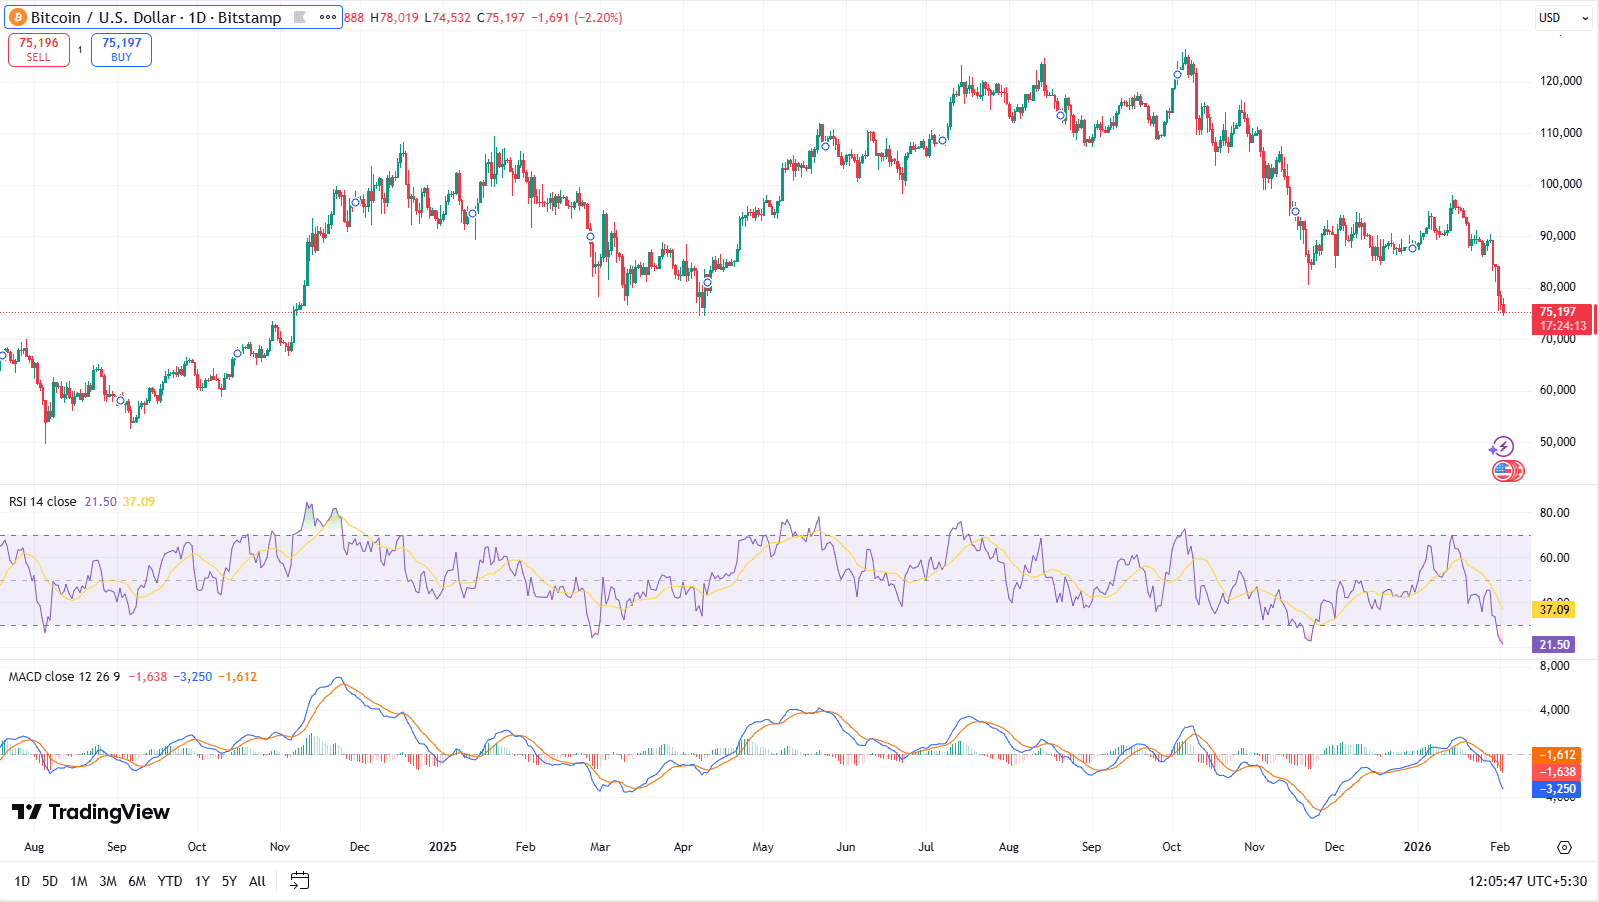
The MACD indicator shows strong bearish momentum with the signal lines deeply negative. This confirms the strength of the current downtrend rather than suggesting an imminent bounce. The price structure displays a series of lower highs and lower lows stretching back from the October peak, the textbook definition of a downtrend.
Trading volume expanded significantly during the collapse, reaching $75 billion daily. High volume during price declines indicates genuine selling pressure rather than low-liquidity manipulation. The chart pattern suggests bitcoin needs to reclaim the $82,000 to $84,000 zone before the immediate downside risk diminishes.
What's Next For Bitcoin Price?
Technical analysts are watching the low to mid-$70,000 range as the next major support zone.
Historical patterns suggest extended recovery periods. After the 2021 peak, bitcoin took 28 months to recover. Following the 2017 initial coin offering boom, the recovery lasted nearly three years. Laurens Fraussen, an analyst at Kaiko, notes that exchange volume contractions during the 2017-2019 period saw 60% to 70% declines, while the 2021-2023 drawdown was more moderate at 30% to 40%.
Raoul Pal, founder of Global Macro Investor, argues the selloff reflects a broader liquidity shortage rather than crypto-specific problems. He notes that Software as a Service stocks fell in tandem with bitcoin, suggesting macro liquidity issues rather than sector-specific failures. The temporary U.S. liquidity drain has been worsened by government shutdowns and what Pal describes as "issues with U.S. plumbing."
— Raoul Pal (@RaoulGMI) February 1, 2026
Spot bitcoin ETFs continue bleeding capital, signaling weakening conviction among mainstream buyers. Many of these investors are now underwater after purchasing at higher prices. Large institutional players have also reduced their purchases following stock price corrections in digital asset companies, removing another source of demand.
Conclusion
Bitcoin's crash to $75,000 represents a convergence of geopolitical stress, structural market weaknesses, and forced liquidations during historically thin weekend trading. The selloff wiped out $800 billion in market value and exposed persistent liquidity problems that have plagued crypto markets since October.
While mega-whales continue accumulating at lower prices, retail capitulation and institutional demand reduction have left the market without sufficient buying pressure to absorb forced selling. Technical indicators confirm strong bearish momentum, with key support levels broken and resistance now established at former support zones. The current market structure, combined with historical recovery timeframes of 24 to 36 months from major peaks, suggests bitcoin faces an extended period of price discovery. Market depth remains 30% below peak levels, spot ETF outflows continue, and the broader liquidity environment offers little support for near-term recovery.
Resources
Bitcoin on TradingView: Bitcoin price action
Report by The WallStreet Journal: Before Any Strike on Iran, U.S. Needs to Bolster Air Defenses in Mideast
Report by Bloomberg: Bitcoin Break Below $80,000 Signals New Crisis of Confidence
Report by CoinDesk: 'This is absolutely INSANE': Bitcoin’s weekend crash exposes the cracks beneath crypto’s latest boom
CoinGlass data: Bitcoin Whale vs Retail Delta
Read Next...


Frequently Asked Questions
What caused bitcoin to crash to $75,000?
Bitcoin crashed due to escalating U.S.-Iran tensions that drove investors toward the U.S. Dollar, combined with $2.5 billion in forced liquidations during thin weekend trading. The selloff was amplified by broken technical support levels and fragile market liquidity that has not recovered since October's market disruption.
Is bitcoin still a safe haven asset?
The weekend selloff demonstrated that bitcoin does not behave as a traditional safe haven during geopolitical stress. Instead of attracting capital like gold traditionally does, bitcoin was sold alongside other risk assets as traders sought U.S. Dollar safety. Even gold and silver dropped sharply, suggesting a broader "de-risking" across all hard assets.
How long will bitcoin's bear market last?
Historical patterns suggest 24 to 36 months for full recovery from major peaks. After the 2021 high, bitcoin took 28 months to recover, while the post-2017 bear market lasted nearly three years. Current market depth remains 30% below October levels, similar to conditions after the 2022 FTX collapse, indicating the downturn may still be in early stages.
Author
 Soumen Datta
Soumen has been a crypto researcher since 2020 and holds a master’s in Physics. His writing and research has been published by publications such as CryptoSlate and DailyCoin, as well as BSCN. His areas of focus include Bitcoin, DeFi, and high-potential altcoins like Ethereum, Solana, XRP, and Chainlink. He combines analytical depth with journalistic clarity to deliver insights for both newcomers and seasoned crypto readers.
(Advertisement)
Latest News
0h : 20m ago

Grayscale Picks Its Most Promising Tokenization Blockchains
2h : 17m ago

Crypto's Top Five Centralized Exchanges
3h : 22m ago

How Is Polygon Trying to Connect Every Blockchain Into a Single Network?
7h : 52m ago

What Does It Really Mean To Host A Website On The Internet Computer?
July 15, 2026

REAL Joins Blockchain for Europe to Shape EU Tokenisation Rules
July 15, 2026

Which Crypto Companies and Protocols Make The Most Money?
July 15, 2026

How SBI Built Japan's Largest Crypto Business
July 15, 2026

Elon Musk And Dogecoin: How One Man Shaped A Memecoin’s Price And Reputation
(Advertisement)

Crypto Project & Token Reviews
Project & Token Reviews
Comprehensive reviews of crypto's most interesting projects and assets
Learn about the hottest projects & tokens
Latest Crypto Articles
Get up to date with the latest crypto news stories and events